

- October 30, 2020
- Posted by: Tradingshot Articles
- Category: Cryptocurrency
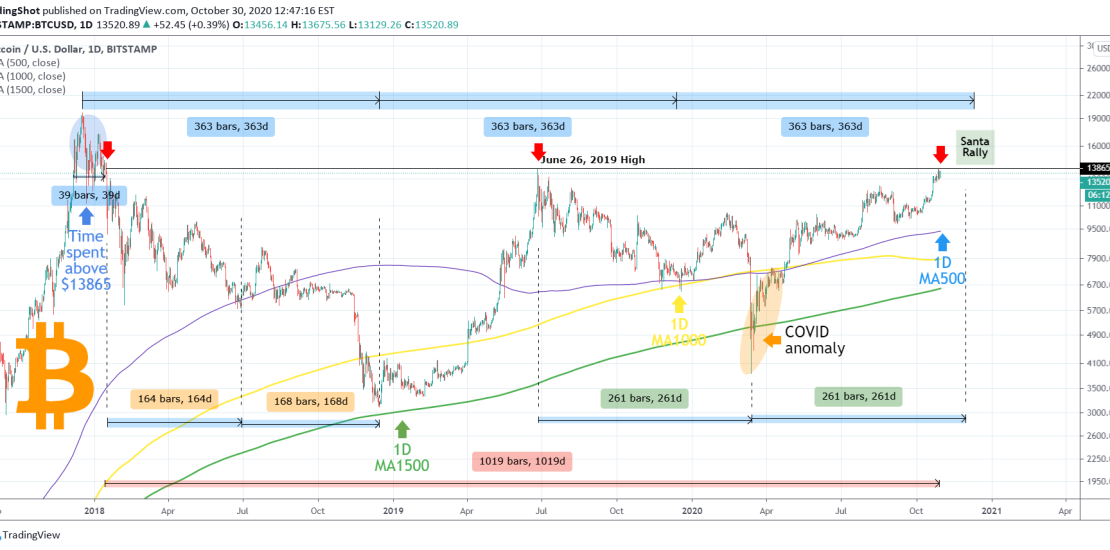
** Only 39 days above 13865 ever! **
First of all, believe it or not, Bitcoin has historically only spent 39 days above the 13865 level! That is roughly only 5 weeks, just over 1 month! And to put things more into perspective, since Bitcoin’s last day above 13865 (January 15, 2018), we have spend 1019 days below it! That alone should be enough to highlight the importance of breaking above the 13865 for the current uptrend.
** Perfect Symmetry shows a break-out should take place soon **
Bitcoin has shown numerous times both on short and long-term time-frames that the patterns it follows can be symmetrical.
For example in 2018, from the time it broke back below 13865 until its new (at the time) 5750 Low, was 164 days. Roughly the same time (169 days) it took from that low to make the latest market Bottom in December 2018.
When BTC reached the critical 13865 level again (June 26, 2019), it made the new (COVID) Low 261 days later. It should be no surprise to us if in 261 days roughly from the Low (i.e. a day before December 01), the 13865 level has broken. And if it does it could look what an end-of-the-year ‘Santa Rally’ is for the stock market.
** The 1D MA500, 1000 and 1500 **
At this point, I would like to bring forward a potential pattern regarding the 500, 1000 and 1500 MA periods on the 1D time-frame. The MA1000 – MA1500 zone on 1D has been the Buy Zone for BTCUSD during the previous Cycle and I have made a few studies on that, which gave timely buy entries since 2019.
The MA1500 (green trend-line) provided the Support on the December 2018 Low. The MA1000 (yellow trend-line) on the December 2019 Low and that would have held if COVID and the consequential lockdowns didn’t inflict panic and fire selling on all asset classes globally. So excluding this period of anomaly, it is the MA500’s turn (blue trend-line) to provide support. As long as that holds, the uptrend will be sustained and sooner than many expect, a new High can be made.
So what do you think? Will Bitcoin break 13865 soon and initiate a Santa Rally?
Feel free to share your work and let me know in the comments section!
Please like, subscribe and share your ideas and charts with the community!
——————————————————————————————————–
!! Donations via TradingView coins also help me a great deal at posting more free trading content and signals here !!
🎉 👍 Shout-out to TradingShot’s 💰 top TradingView Coin donor 💰 this week ==> TradingView
——————————————————————————————————–
