

- November 20, 2020
- Posted by: Tradingshot Articles
- Category: Cryptocurrency
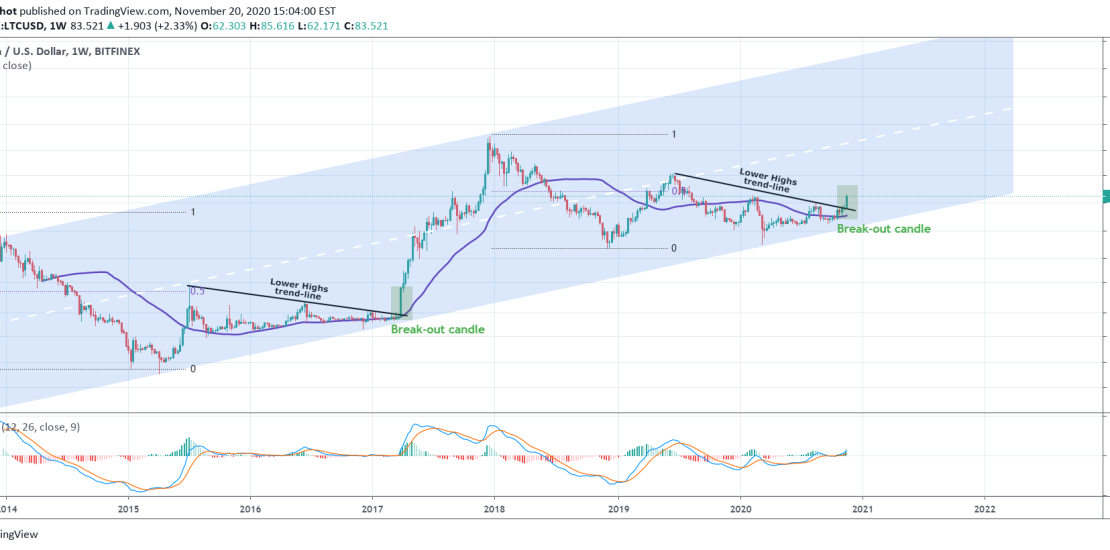
This is a simple comparison on LTCUSD of the current cycle with the previous. As seen on the chart, on March 2017, Litecoin broke above the accumulation sequence that was contained under a Lower Highs trend-line and that 1W candle was what kick-started its parabolic Bull Run.
Right now the situation is exactly the same. The current 1W candle is the strongest since April 2019 and just broke above the Lower Highs trend-line with the MA50 well is support. Can this be the start of the new parabolic run?
This is something I looked at last time in September:

** Please support this idea with your likes and comments, it is the best way to keep it relevant and support me. **
——————————————————————————————————–
!! Donations via TradingView coins also help me a great deal at posting more free trading content and signals here !!
🎉 👍 Shout-out to TradingShot’s 💰 top TradingView Coin donor 💰 this week ==> johnmcal3
——————————————————————————————————–
Tradingview link: