

- October 23, 2020
- Posted by: Tradingshot Articles
- Category: Cryptocurrency
Last week I posted the following chart on Ethereum:

** The Inner Channel Up **
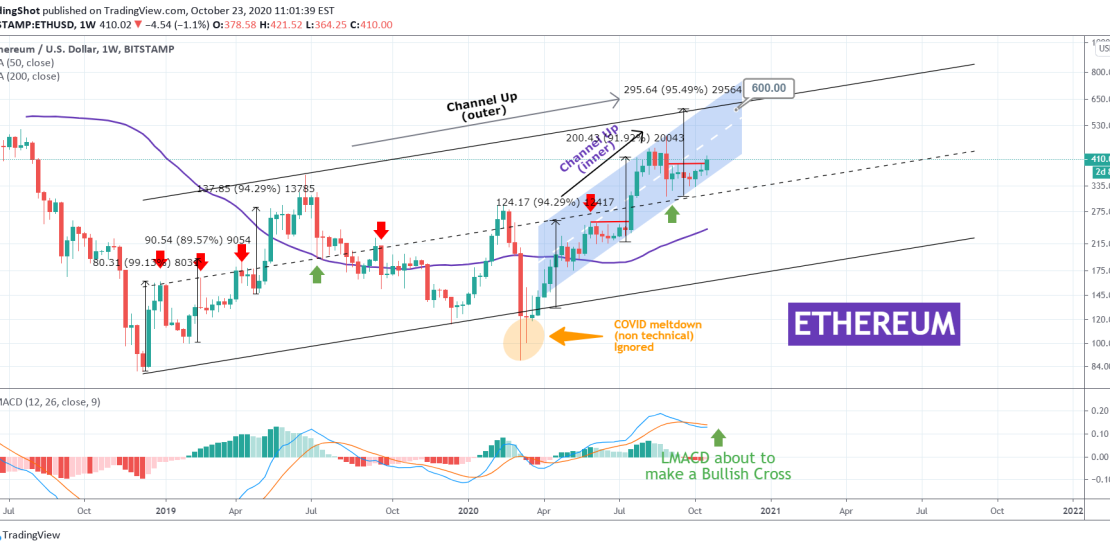
It was about the final Resistance level of 400 that ETH had to break before its April Channel Up (inner/ blue) on the 1D chart turned bullish again. Well it happened, as the 1D MA50 turned into Support, and the price is moving higher.
** The Outer Channel Up **
My attention now shifts back to the 1W chart, which (excluding the March melt-down) is dictated by a very clear Channel Up too (outer). See how harmonically the price is pivoting on the middle (dashed) trend-line of this Channel Up (red and green arrows). This Channel started after the December 2018 bottom and since then, it is the first time that a weekly candle closes that high after a bounce on the middle trend-line. Clear bullish strength with the sentiment getting even stronger as the LMACD is about to make a bullish cross.
Can Ethereum take advantage of this momentum and reach $600 before the end of the year, which will be a Higher High on the long-term (outer) Channel Up? A roughly +95% increase from the last low, certainly shows it can! And as you see on the chart this +95% rise has been consistent in marking Higher Highs since December 2018, successfully making 5 occurrence already!
Feel free to share your work and let me know in the comments section!
Please like, subscribe and share your ideas and charts with the community!
——————————————————————————————————–
!! Donations via TradingView coins also help me a great deal at posting more free trading content and signals here !!
🎉 👍 Shout-out to TradingShot’s 💰 top TradingView Coin donor 💰 this week ==> TradingView
——————————————————————————————————–
Tradingview link:
https://www.tradingview.com/chart/ETHUSD/duV3LCWb-ETHEREUM-on-the-weekly-chart-Is-600-achievable