
-
XAUUSD Can scratch 1900 but watch the 1D candle closes
- May 16, 2022
- Posted by: Tradingshot Articles
- Category: Commodities
No Comments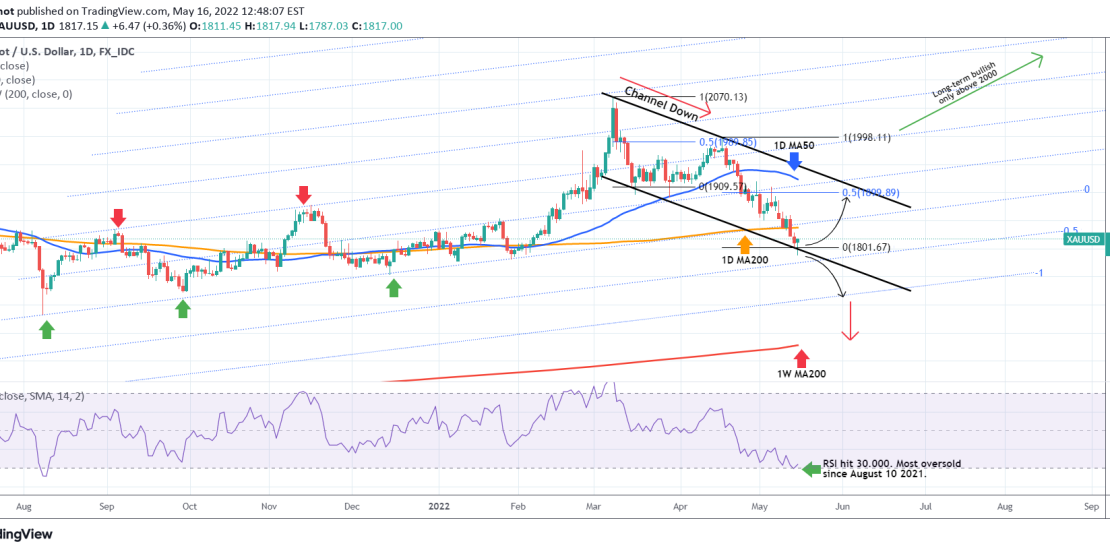
Gold (XAUUSD) has been trading within a Channel Down since its March 08 top due to the ‘fear’ mix of war and inflation. On Thursday it broke below its 1D MA200 (orange trend-line) for the first time since February 07 2022 and Friday saw the price touch the bottom (Lower Lows trend-line) of the
-
GASOLINE Buy the dip for the next 2 months
- May 12, 2022
- Posted by: Tradingshot Articles
- Category: Commodities
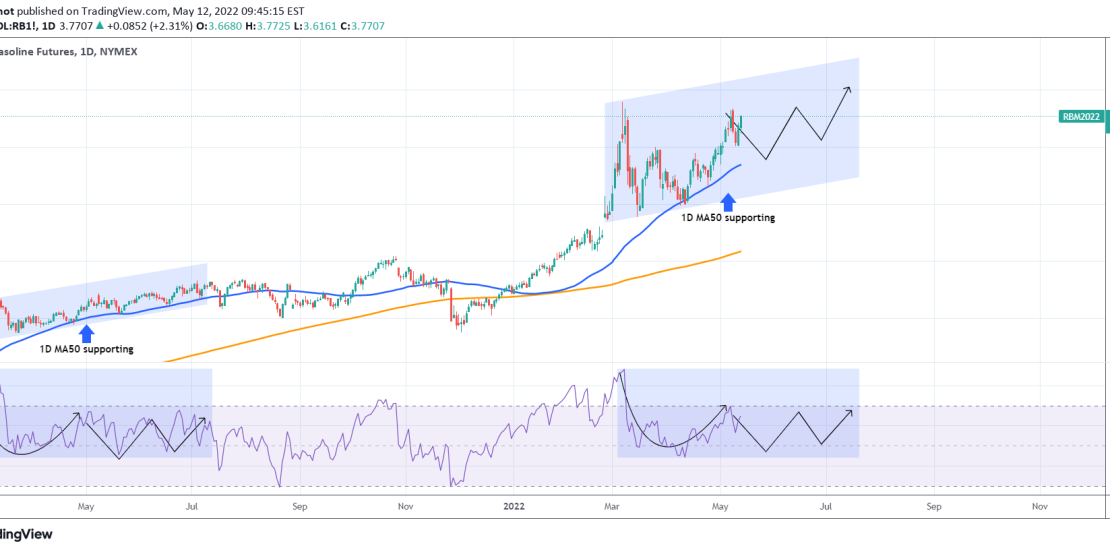
Gasoline (RB1!) has been supported by the 1D MA50 (blue trend-line) since January 2022 and after the most recent contact with the trend-line (April 07 2022), it has been on a strong rise. This shouldn’t surprise us as the 1D RSI has been printing the same pattern as the March – June 2021 period,
-
NATURAL GAS Multi-year Cycles.
- April 26, 2022
- Posted by: Tradingshot Articles
- Category: Commodities
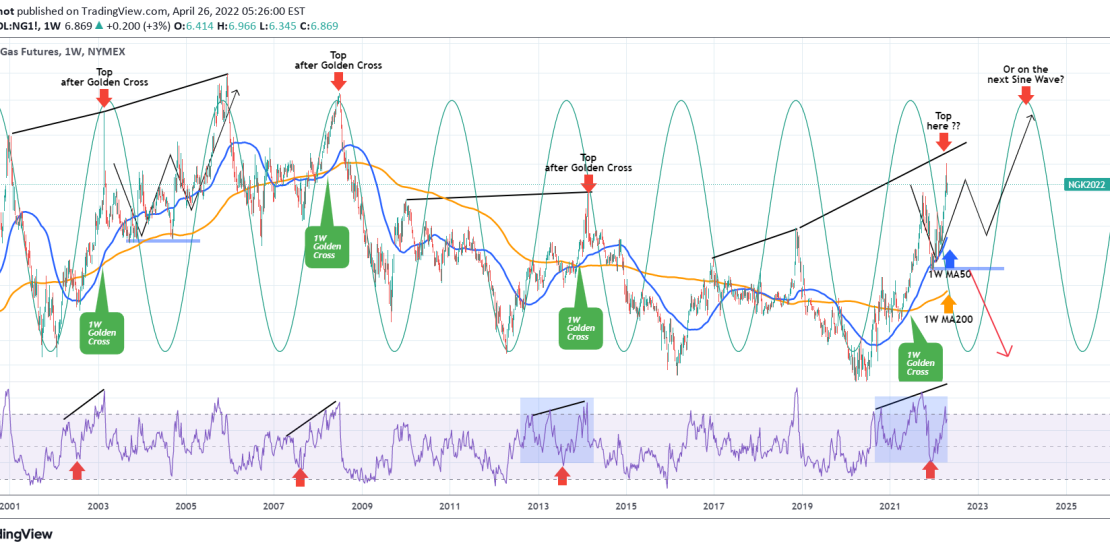
Natural Gas (NG1!) has been one of the most profitable trading assets of the year offering great returns. On a long-term scale though (1W time-frame on this chart) it has starting to form a peak pattern, which we have seen previously in the past 20 years. I’ve plotted the Sine Waves on the chart
-
XAUUSD long-term bullish and bearish levels.
- March 23, 2022
- Posted by: Tradingshot Articles
- Category: Commodities
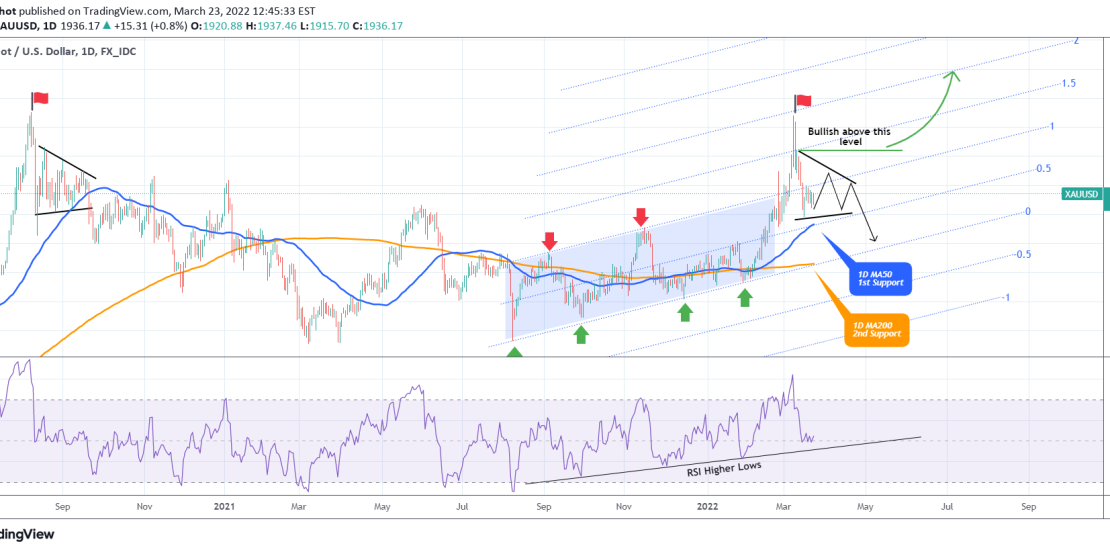
Gold (XAUUSD) has exhausted the late February – early March rally and since the March 08 peak, has corrected back near the 1D MA50 (blue trend-line). That is the 1st Support and should be enough to hold the price for at least another 3 weeks. Basically that rally and subsequently the blow-off top, resembles
-
COMMODITIES running wild everywhere. Decade-long cycles in play.
- March 8, 2022
- Posted by: Tradingshot Articles
- Category: Commodities
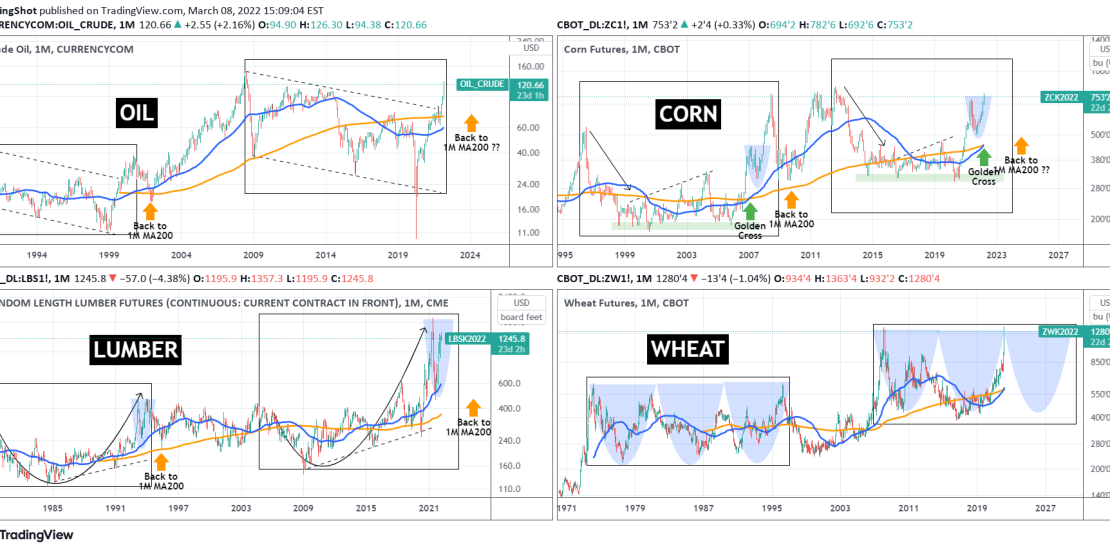
The talk of the street, since the war broke out between Russia and Ukraine, has been how aggressively commodities have been rising. Of course this rise hasn’t started this month or the previous but is the outcome of inflation running high on historic levels since the March 2020 COVID crash, when global central banks
-
XAUUSD Targets in case of further war escalation or deescalation
- March 8, 2022
- Posted by: Tradingshot Articles
- Category: Commodities
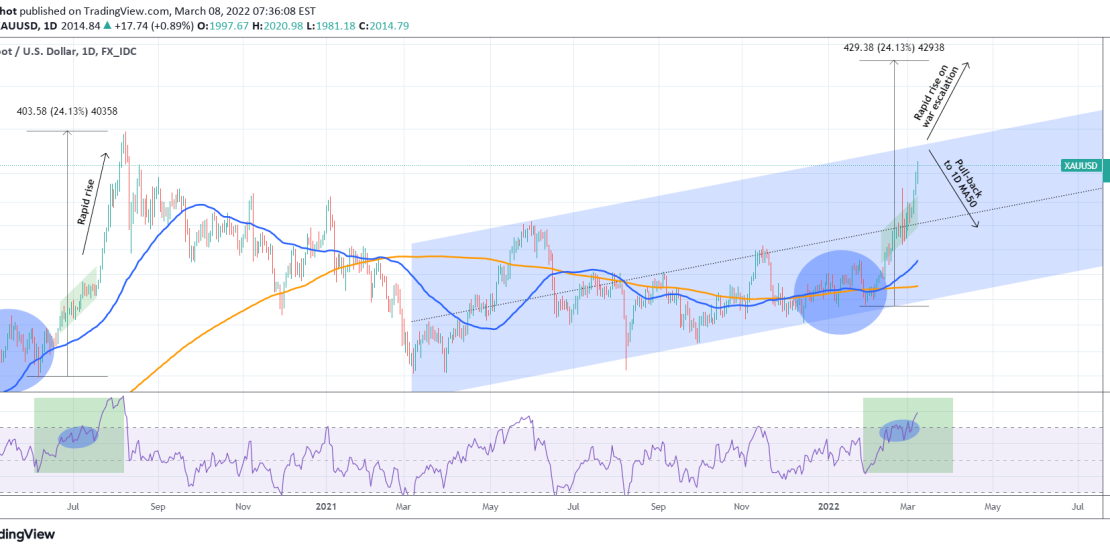
Gold has seen a rapid rise in recent weeks as investors seek safe haven shelter during the start of the Ukraine – Russia war. The result has been an aggressive detachment of the price from its 1D MA50 (blue trend-line), where Gold has been trading around using it as a pivot since August 2021.
-
WTI OIL at $100! Best short for the next 12 – 18 months!
- February 24, 2022
- Posted by: Tradingshot Articles
- Category: Commodities
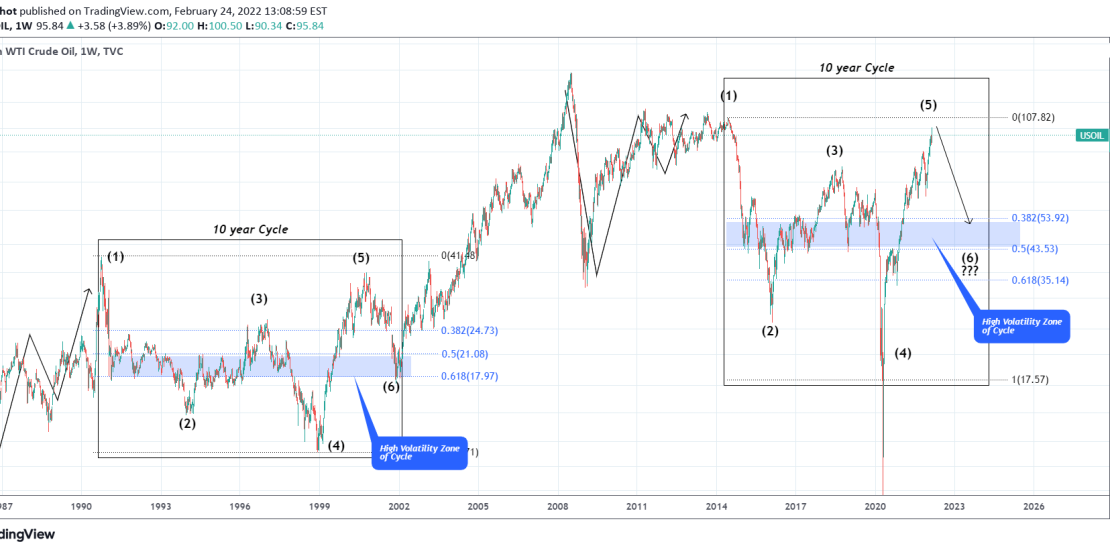
WTI Oil is among the major gainers of the current geopolitical conflict in Ukraine, hitting the $100 mark for the first time in roughly 8 years. Fundamentally this happens most of the times during periods of unrest or even worse war, such as the one that broke out yesterday. In times like these, it
-
XAUUSD Big upside potential
- February 9, 2022
- Posted by: Tradingshot Articles
- Category: Commodities
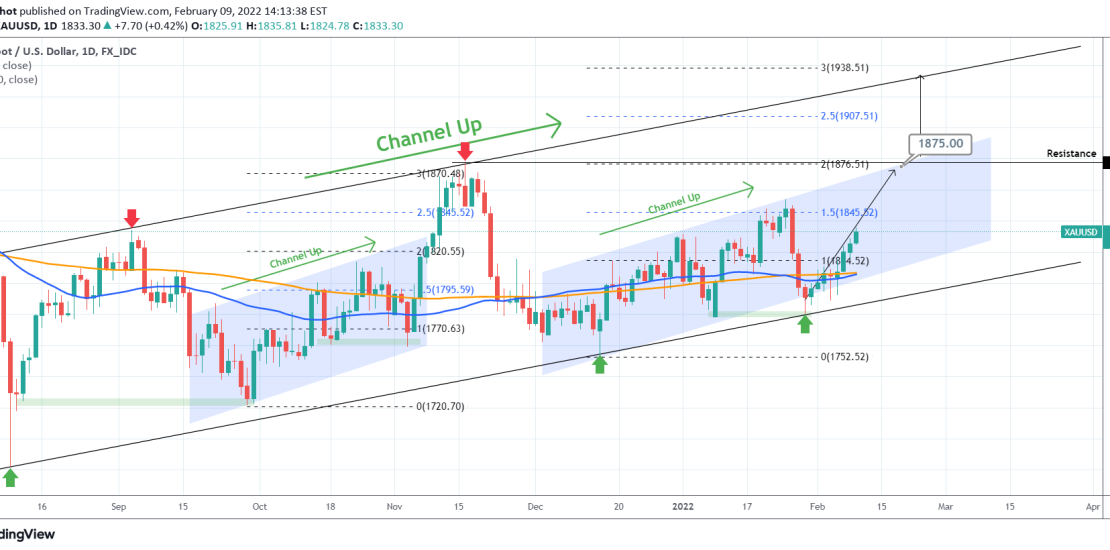
Gold is on a sustainable uptrend after holding the 1,780 Support following my buy update two weeks ago: This time I am putting things on a wider perspective and besides the two small Channel Up patterns, I’ve displayed the wider one that started with the August 09 2021 market bottom. As previously mentioned, the
-
XAUUSD Channel Up + 1 extra Support towards 1875
- January 27, 2022
- Posted by: Tradingshot Articles
- Category: Commodities
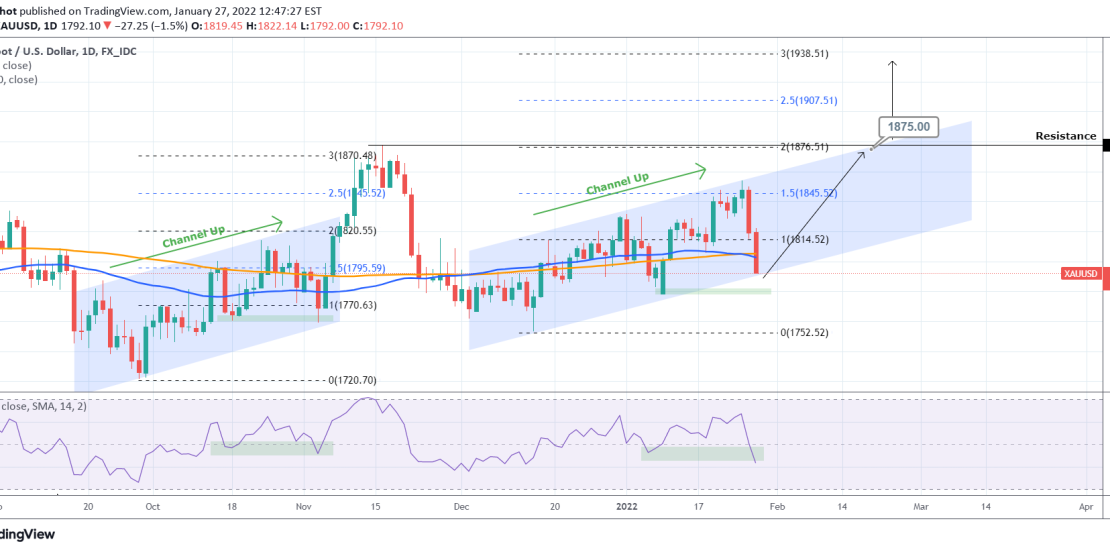
Gold is being sold aggressively following Powell’s comments on the expected inflation yesterday, despite being considered a counter-inflation asset. Technically that sell-off can be attributed to the chart I posted 1 week ago on the selling pressure that the top of the long-term Triangle applies: On the shorter term and the 1D time-frame, Gold
-
XAUUSD Major long-term break-out ahead.
- January 20, 2022
- Posted by: Tradingshot Articles
- Category: Commodities
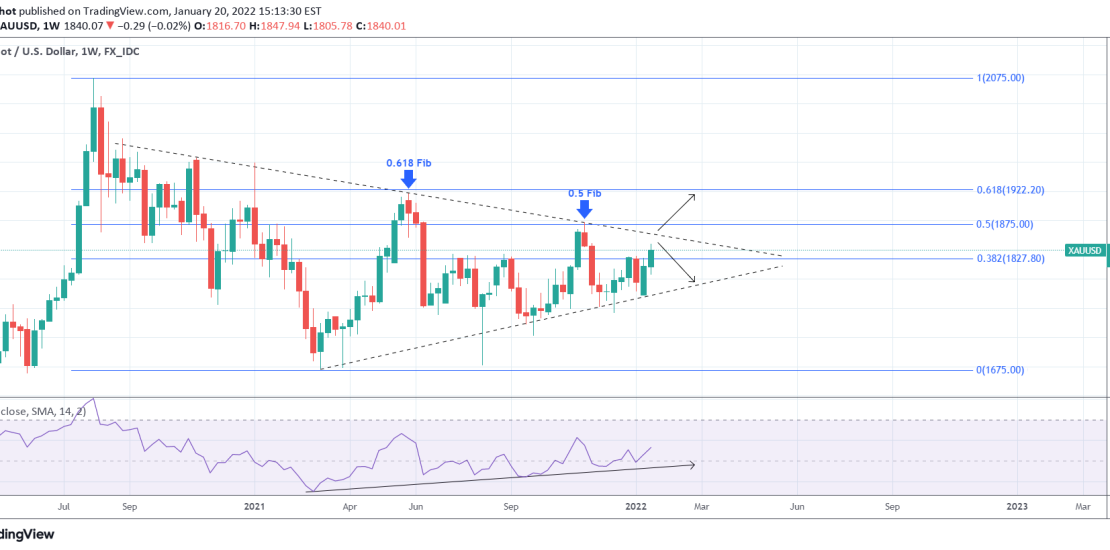
Gold eventually followed the pattern presented on my last analysis (see chart below) and after completing the Bull Flag, it reversed and broke above the 1834 Resistance: The immediate target on the short-term is 1875 (Resistance at 1877.50). However, this latest development brings us ahead of a potential huge long-term break-out. Today’s chart is
