

- April 26, 2022
- Posted by: Tradingshot Articles
- Category: Commodities
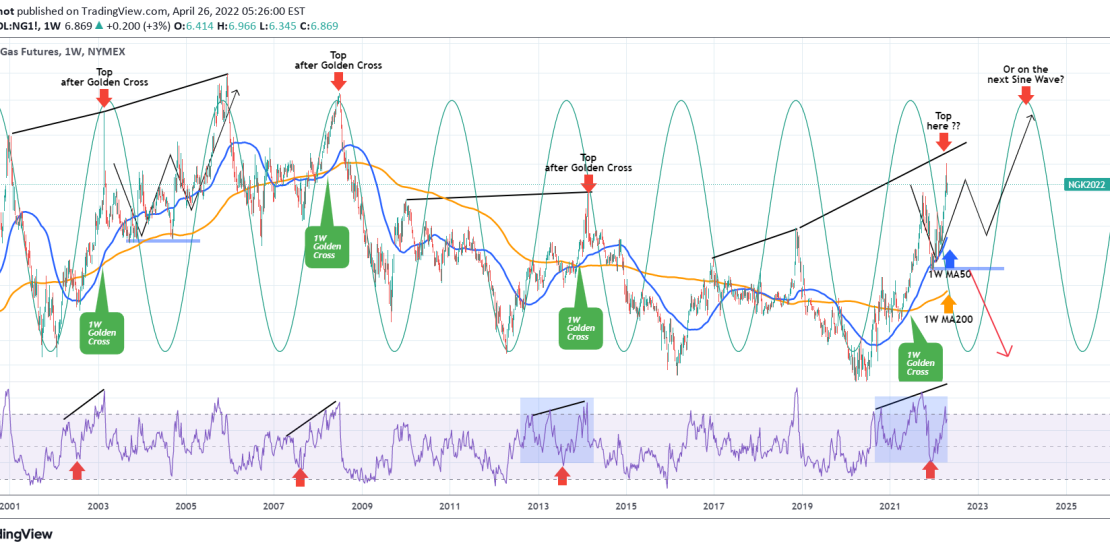
Natural Gas (NG1!) has been one of the most profitable trading assets of the year offering great returns. On a long-term scale though (1W time-frame on this chart) it has starting to form a peak pattern, which we have seen previously in the past 20 years.
I’ve plotted the Sine Waves on the chart to more efficiently illustrate NG’s long-term cycles. Currently it is within a Bull Cycle having formed a Golden Cross (MA50 crossing above the MA200) last June. However after every 1W Golden Cross since 2000, the market made a Top shortly after. This was disrupted this year due to the Ukraine-Russia war and as a result the price negated the peak of October 2021 and broke outside the Sine Wave.
This is not the first time we see that. On the upside this took place in December 2003 – January 2004 and on the downside in June 2015. If 2004 – 2005 is repeated, we should see the price pull-back immediately towards the 1W MA50 (blue trend-line) and within this year towards the 1W MA200 (orange trend-line), and then rebound on Higher Highs/ Higher Lows towards the next Sine Wave to form a Top. On the other hand, this is negated if we get 2 straight weekly (1W) candle closings below the 1W MA200 or if the December 2021 low of 3.535 breaks first.
Tradingview link:
https://www.tradingview.com/chart/NG1!/ejIuwfIi-NATURAL-GAS-Multi-year-Cycles