

- May 16, 2022
- Posted by: Tradingshot Articles
- Category: Commodities
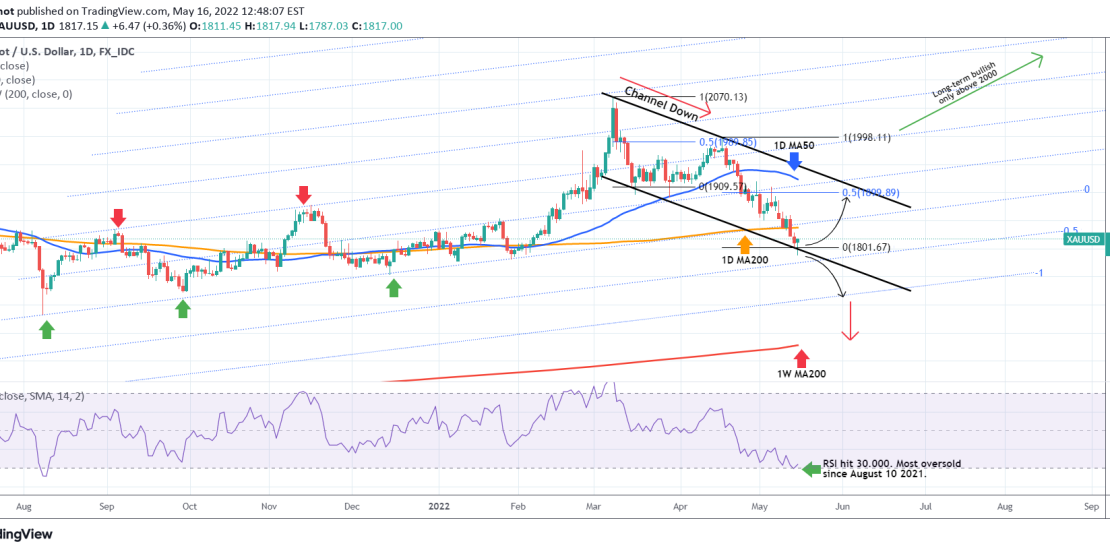
Gold (XAUUSD) has been trading within a Channel Down since its March 08 top due to the ‘fear’ mix of war and inflation. On Thursday it broke below its 1D MA200 (orange trend-line) for the first time since February 07 2022 and Friday saw the price touch the bottom (Lower Lows trend-line) of the Channel Down. Today it marginally broke below it, with the 1D RSI hitting the 30.000 oversold mark but the price is recovering and we should pay close attention to the 1D candle closings.
As long as we close inside the Channel Down, it is more likely to see a rebound towards the 0.5 Fibonacci retracement level of the last Lower High, as seen on the previous rebound within the Channel. If done within May, it may test the 1D MA50 (blue trend-line) as a Resistance.
If however a 1D candle closes below the Lower Lows trend-line, I expect the price to seek the lower Channel Fibonacci extension of -1.00 around 1720 – 1715. Below 1700, the way opens for a 1W MA200 (red trend-line) test, for the first time since December 06 2018.
Note that in order for the long-term bullish trend to be restored, Gold has to break the previous Lower High which was marginally below 2000.
Tradingview link: