

- January 20, 2022
- Posted by: Tradingshot Articles
- Category: Commodities
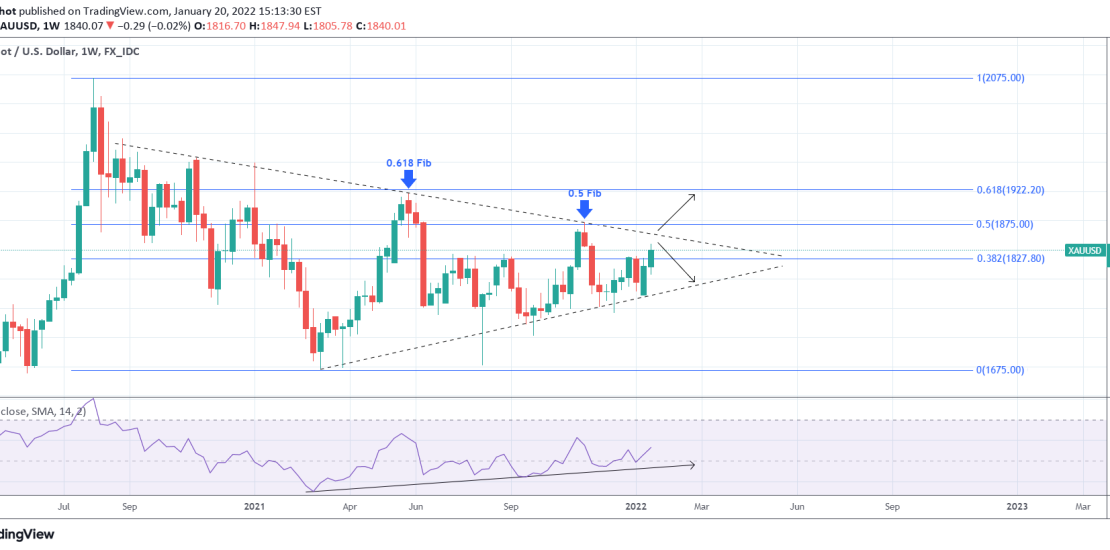
Gold eventually followed the pattern presented on my last analysis (see chart below) and after completing the Bull Flag, it reversed and broke above the 1834 Resistance:

The immediate target on the short-term is 1875 (Resistance at 1877.50). However, this latest development brings us ahead of a potential huge long-term break-out. Today’s chart is on the 1W time-frame, where this possibility can be more effectively presented.
As you see, XAUUSD has been trading within a Triangle pattern of Lower Highs and Higher Lows since late August 2020. No 1W candle has closed above or below this structure, not even the weekly candle of August 09 2021 which started will a collapse but quickly recovered and closed well above the Higher Lows of the Triangle. This indicates that the market has been ranging and investors have been waiting in anticipation of a longer term break-out. A rejection on the Lower Highs trend-line should pull the price back below 1800 marginally. A 1W candle close above the Lower Highs could target the 1915 High of the May 31 2021 1W candle, which interestingly enough is on the 0.618 Fibonacci retracement level. If you are a long-term trader, use this pattern to your advantage.
Tradingview link:
https://www.tradingview.com/chart/XAUUSD/gHV8KTvg-XAUUSD-Major-long-term-break-out-ahead