

- March 23, 2022
- Posted by: Tradingshot Articles
- Category: Commodities
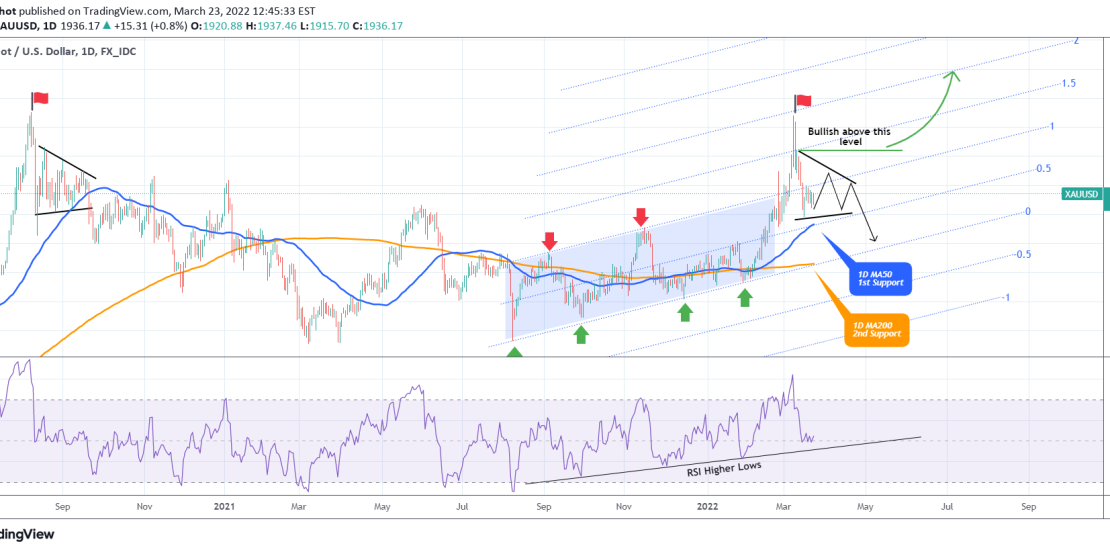
Gold (XAUUSD) has exhausted the late February – early March rally and since the March 08 peak, has corrected back near the 1D MA50 (blue trend-line). That is the 1st Support and should be enough to hold the price for at least another 3 weeks.
Basically that rally and subsequently the blow-off top, resembles the rally and correction of the August 11 2020 peak. After the blow-off top, Gold consolidated within a Triangle and when the 1D MA50 broke, the price eventually turned bearish on the long-term with the next Support being the 1D MA200 (orange trend-line).
The reason it failed to turn bullish instead, was because it didn’t make a Higher High outside the Triangle. As a result, we have that break-out level/ Resistance at around 2010, so above that level, we expect Gold to turn bullish again. On the other hand, a break below the 1D MA50, as in 2020, should add more selling pressure towards the 1D MA200.
Tradingview link:
https://www.tradingview.com/chart/XAUUSD/RKDJU16m-XAUUSD-long-term-bullish-and-bearish-levels