

-
BITCOIN Accumulation phase not over before this cross happens.
- July 26, 2021
- Posted by: Tradingshot Articles
- Category: Cryptocurrency
No Comments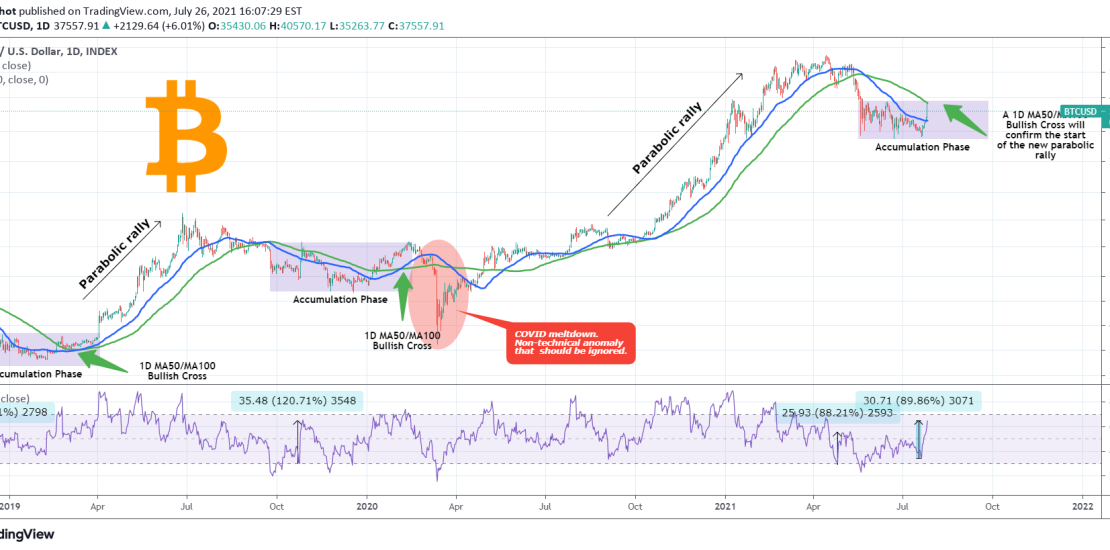
So Bitcoin rallied aggressively to approach the June High in the aftermath of the Apple adoption rumors and other bullish news. In doing so it hit the 1D MA100 (green trend-line). If the sequence since the May 19 low is indeed an Accumulation Phase then based on the previous two phases of this Bull
-
SOLUSD aiming at $130 in Q4.
- July 26, 2021
- Posted by: Tradingshot Articles
- Category: Cryptocurrency
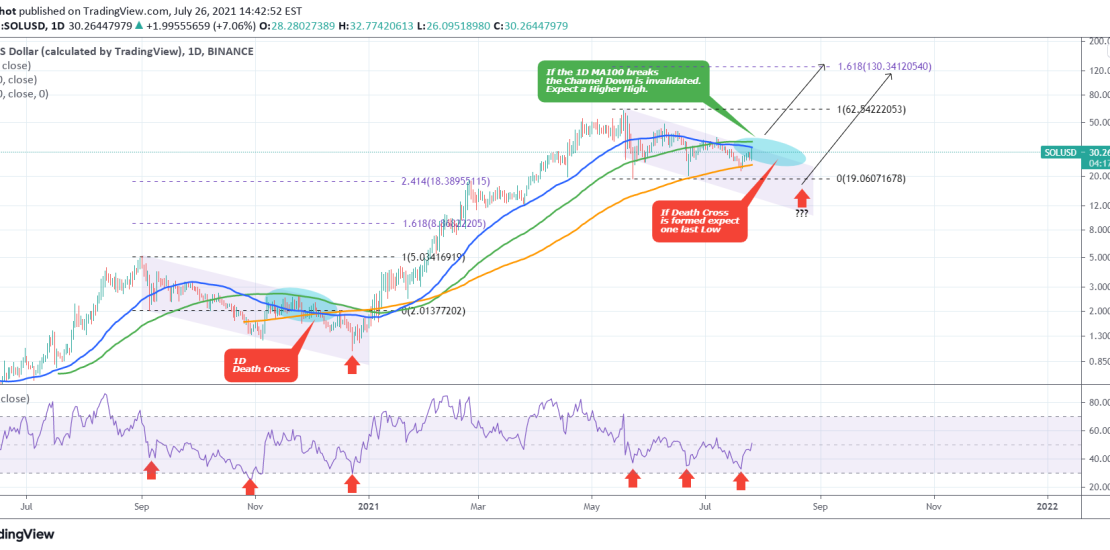
Pattern: Channel Down on 1D. Signal: Buy if the 1D MA100 (green trend-line) breaks. If not and a Death Cross is formed instead, expect a Lower Low which will be the most optimal buy signal. Target: 130.00 (the 1.618 Fibonacci extension). Tradingview link: https://www.tradingview.com/chart/SOLUSD/bVcYQPdr-SOLUSD-aiming-at-130-in-Q4
-
EOSBTC Emerging 1D Death Cross
- July 24, 2021
- Posted by: Tradingshot Articles
- Category: Cryptocurrency
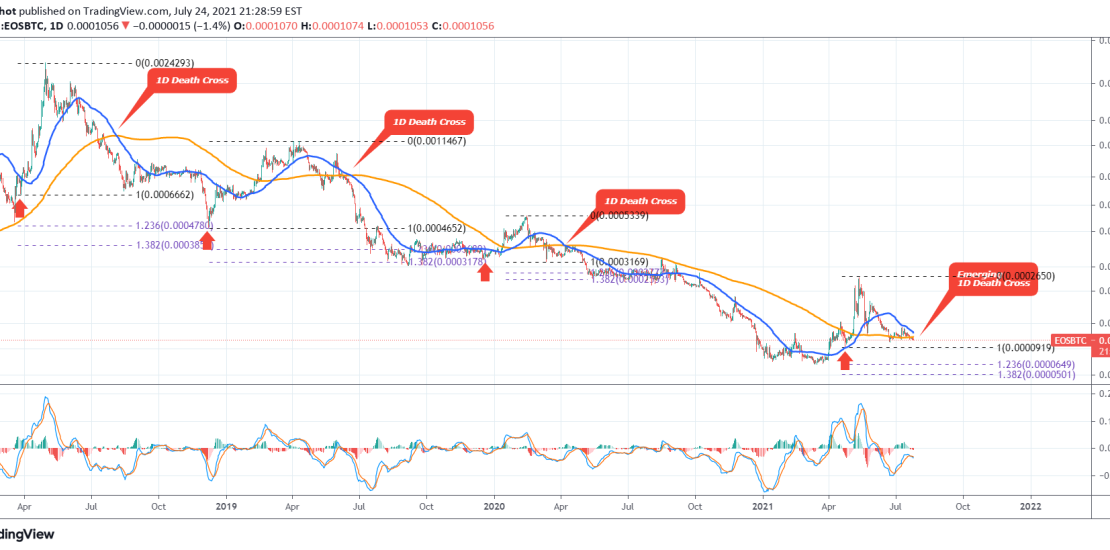
The pair has been consolidating this past month around the 1D MA200 (orange trend-line) and below the 1D MA50 (blue trend-line). A Death Cross is close to forming on 1D (when the MA50 crosses below the MA200) and that is consistent with all price actions prior to such Crosses since the April 2018 market
-
BITCOIN hit the 1D MA50 for the first time since May 12!
- July 24, 2021
- Posted by: Tradingshot Articles
- Category: Cryptocurrency
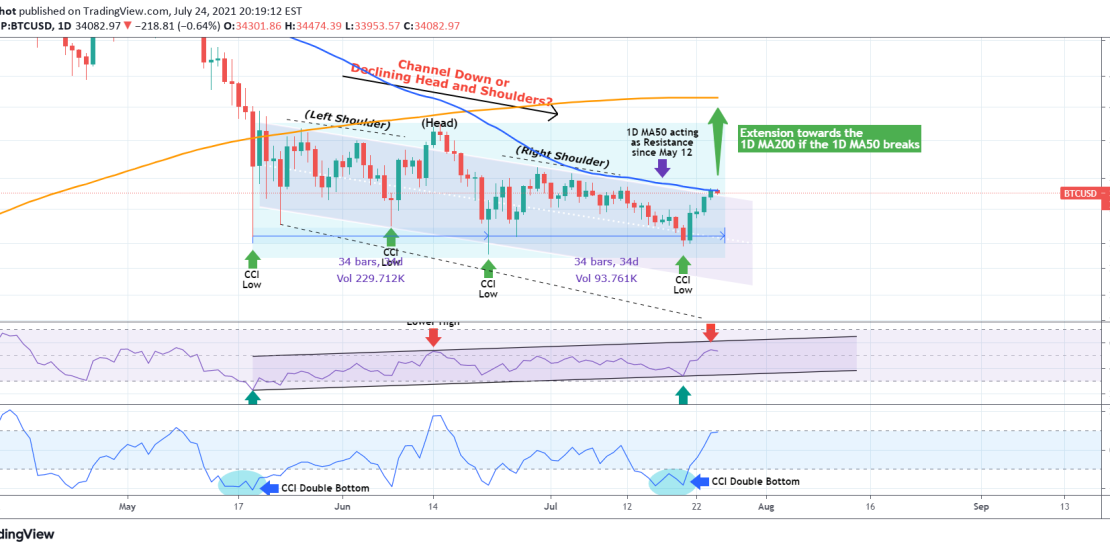
The title really says it all by itself. It is the first time that Bitcoin makes contact with the 1D MA50 (blue trend-line) since May 12, which was the start of the very aggressive 1 week sell-off that dived below 30k. What is critical now is whether or not the price can close a
-
EURUSD A long-term perspective and how it is invalidated
- July 21, 2021
- Posted by: Tradingshot Articles
- Category: Forex
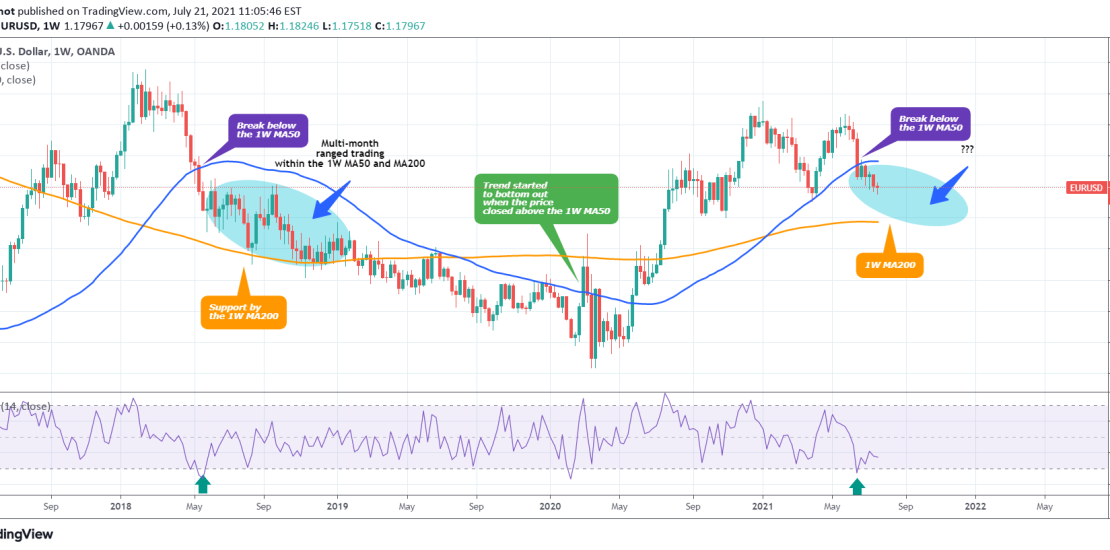
EURUSD has been trading below the 1W MA50 (blue trend-line) for the past 5 weeks. Even though it hasn’t broken below the 1.1700 – 1.1600 Suppor Zone that has been holding for exactly 1 year, it hasn’t traded below the 1W MA50 for that long since the May 2020 bullish break-out. Last time we
-
BITCOIN Triple Bottom formed?
- July 21, 2021
- Posted by: Tradingshot Articles
- Category: Cryptocurrency
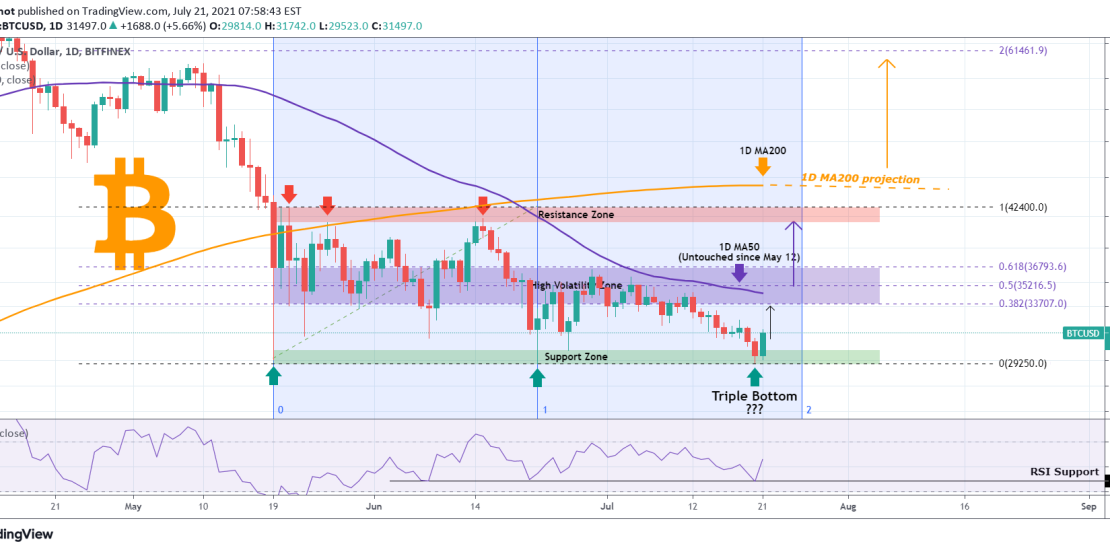
Yesterday’s $29250 low was at a level which previous held on both May 19 and June 22, which has been the Support Zone so far. If this holds again then we have a potential Triple Bottom formation, which technically it is very bullish (the RSI has also triple-bottomed). On top of that, the sentiment
-
S&P500 Buy opportunity on the 1D MA50
- July 19, 2021
- Posted by: Tradingshot Articles
- Category: Stock Indices
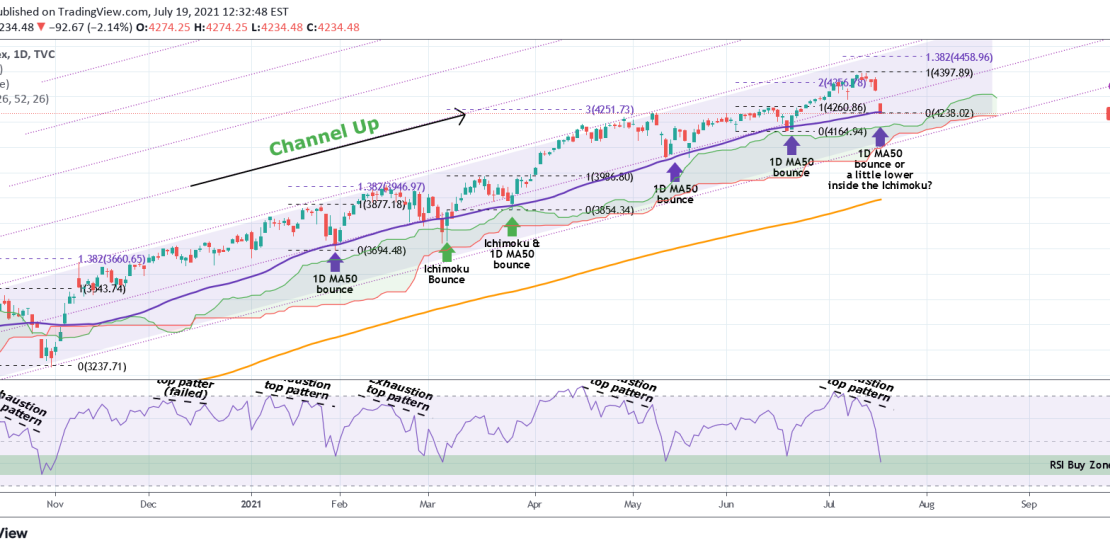
This is a continuation idea to the most recent one: Pattern: Channel Up on 1D. Signal: Buy as the price hit the 1D MA50 (blue trend-line) and the RSI has entered its 1 year Buy Zone. Target: 4450 (the 1.382 Fibonacci extension, which has been the most modest target for a Higher High within
-
US10Y Medium-term sell
- July 13, 2021
- Posted by: Tradingshot Articles
- Category: Other
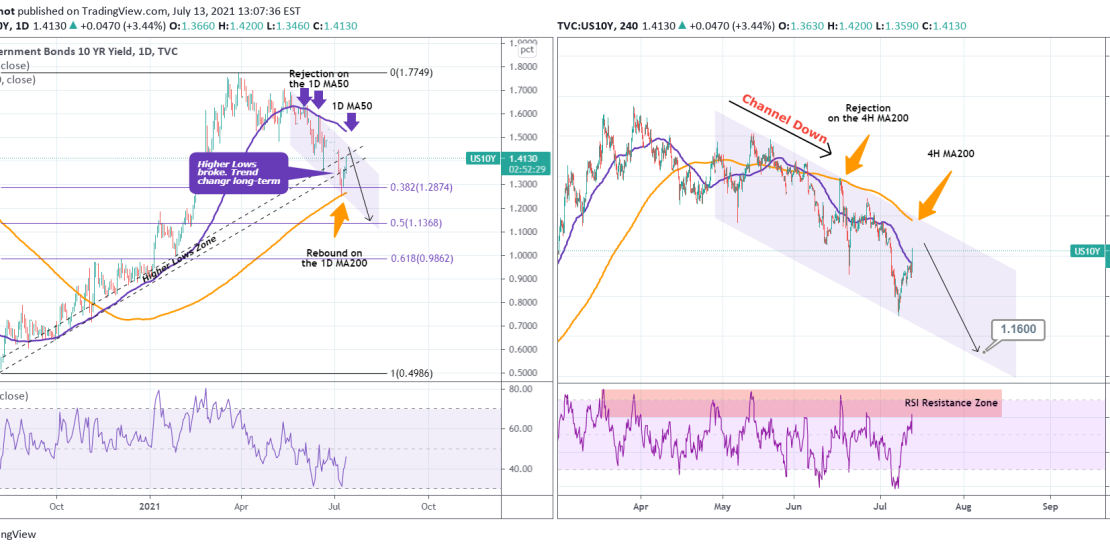
The US10Y has confirmed the shift from bullish to long-term bearish as last week it broke below the Higher Lows Zone that has been holding since the August 07, 2020 bottom. The bounce however on the 1D MA200 (orange trend-line on the left chart) is something to keep an eye on, but for the
-
S&P500 Is it getting ahead of itself?
- July 13, 2021
- Posted by: Tradingshot Articles
- Category: Stock Indices
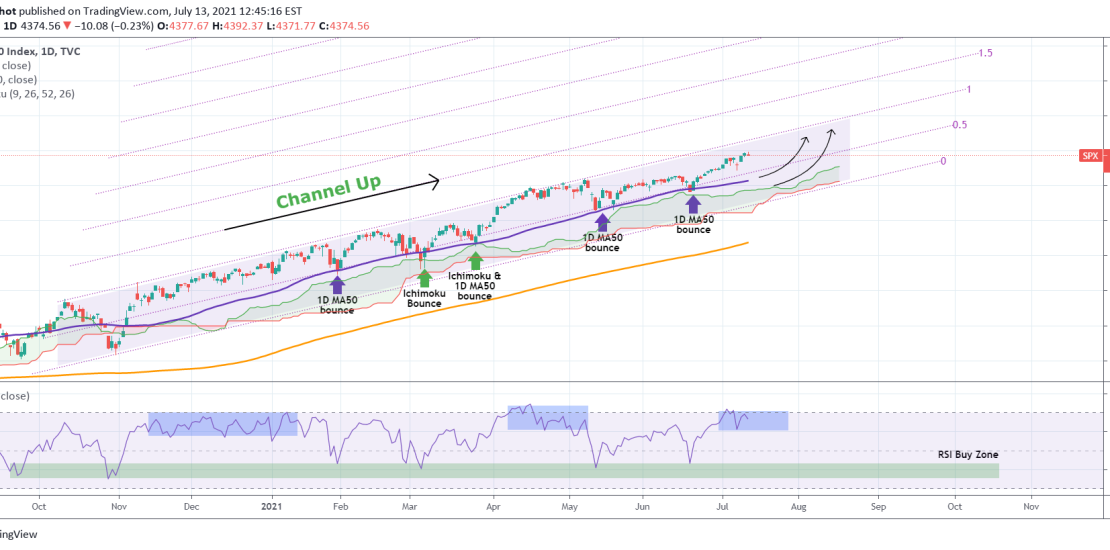
The index has been trading within a Channel Up since the November 2020 elections. The barometer has always been the 1D MA50 (blue trend-line) mostly, where the majority of buy accumulation has been taking place. The Ichimoku Cloud is second. What we see now is the price trading very close to the Higher Highs
-
BITCOIN Does this look like a yearly candle of Cycle Top?
- July 12, 2021
- Posted by: Tradingshot Articles
- Category: Cryptocurrency
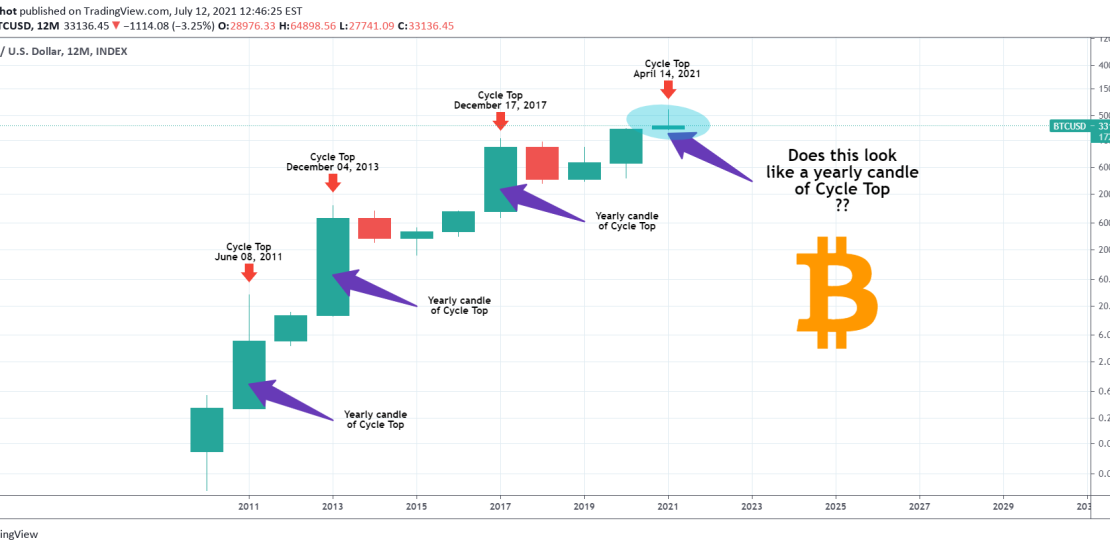
I’ve been meaning to post this chart for a while. There is no fancy technical or fundamentals analysis involved just a thought I wanted to share with the community and get your feedback. This chart is on the 12M time-frame, meaning that each candle represents 12 months i.e. 1 year. As you see each