

- July 13, 2021
- Posted by: Tradingshot Articles
- Category: Other
No Comments
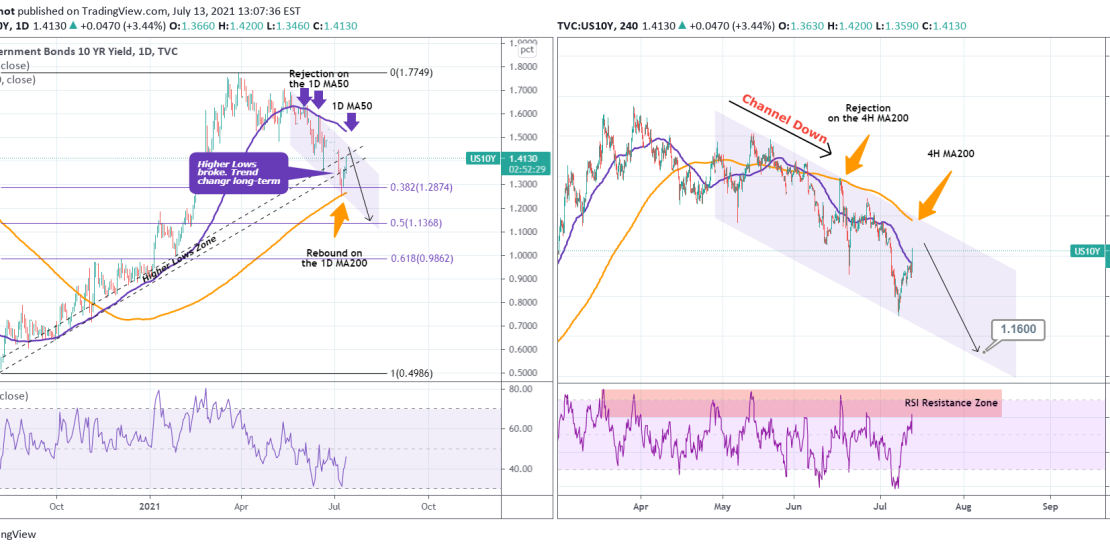
The US10Y has confirmed the shift from bullish to long-term bearish as last week it broke below the Higher Lows Zone that has been holding since the August 07, 2020 bottom. The bounce however on the 1D MA200 (orange trend-line on the left chart) is something to keep an eye on, but for the moment that is viewed as a Lower Lows rebound within a Channel Down (right chart).
The last Lower Highs were made at or close to the 4H MA200 (orange trend-line on the right chart). Since the 4H RSI has just entered its Resistance Zone, it may be a good time to start selling the US10Y. The target is 1.1600, above the 0.5 Fibonacci retracement level (as seen on the left chart).
Most recent US10Y idea:

Tradingview link: