- July 21, 2021
- Posted by: Tradingshot Articles
- Category: Cryptocurrency

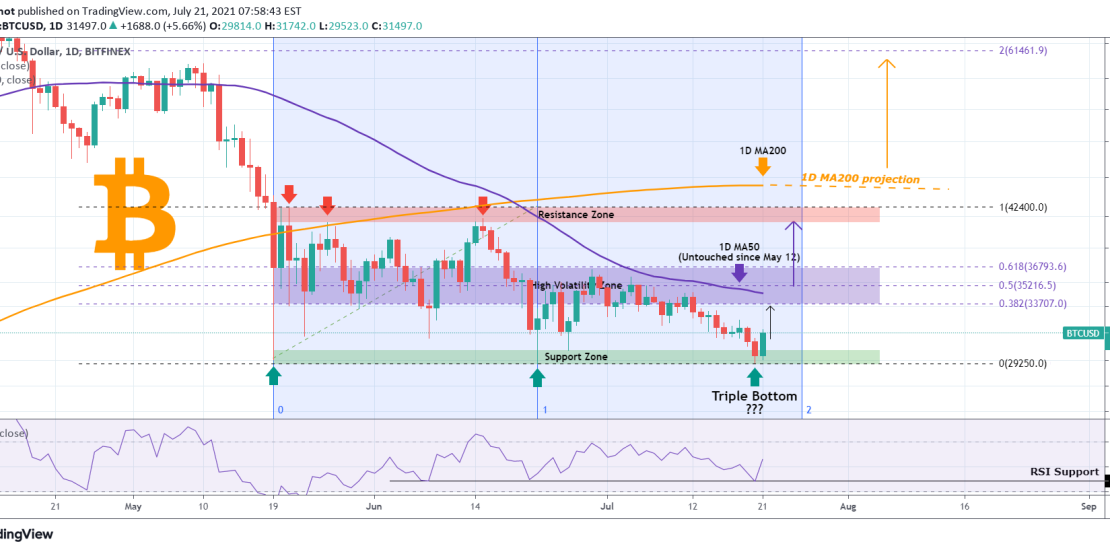
Yesterday’s $29250 low was at a level which previous held on both May 19 and June 22, which has been the Support Zone so far. If this holds again then we have a potential Triple Bottom formation, which technically it is very bullish (the RSI has also triple-bottomed).
On top of that, the sentiment can get even more positive if the 1D MA50 (blue trend-line) breaks, which has been intact since May 12. The 1D MA50 currently happens to be near the 0.5 Fibonacci retracement level, counting 42,400 as the Top of the consolidation during these past 2 months. As you see on the chart, this is also the High Volatility Zone (within the 0.618 – 0.382 Fib), which is the range that attracts most of the price action since the May 19 low.
A 1D candle closing above the 1D MA50, restores the bullish sentiment on the short-term, at least towards the 41,000 – 42,200 Resistance Zone. On the long-term though, only a break above the 1D MA200 (orange trend-line), can restore the buying sentiment and if it happens the technical target is the 2.0 Fibonacci extension, which is almost on the All Time High level. If the Support though fails, besides the long-term moving averages involved, the next horizontal Support is on the 21,900 low of December 21, 2020.
It is worth mentioning at this stage that if this consolidation is currently an accumulation phase before a major rally, it could be symmetrical and by applying the Time Fibonacci Zones (start May 19 low, middle June 22 low), we can see that there is less than a week left before it breaks. Of course that cannot be confirmed but it is worth keeping it in mind in case of volume spikes.
So do you think that we have a Triple Bottom on 29500?
Tradingview link:
https://www.tradingview.com/chart/BTCUSD/XntRaaAi-BITCOIN-Triple-Bottom-formed

