- July 21, 2021
- Posted by: Tradingshot Articles
- Category: Forex

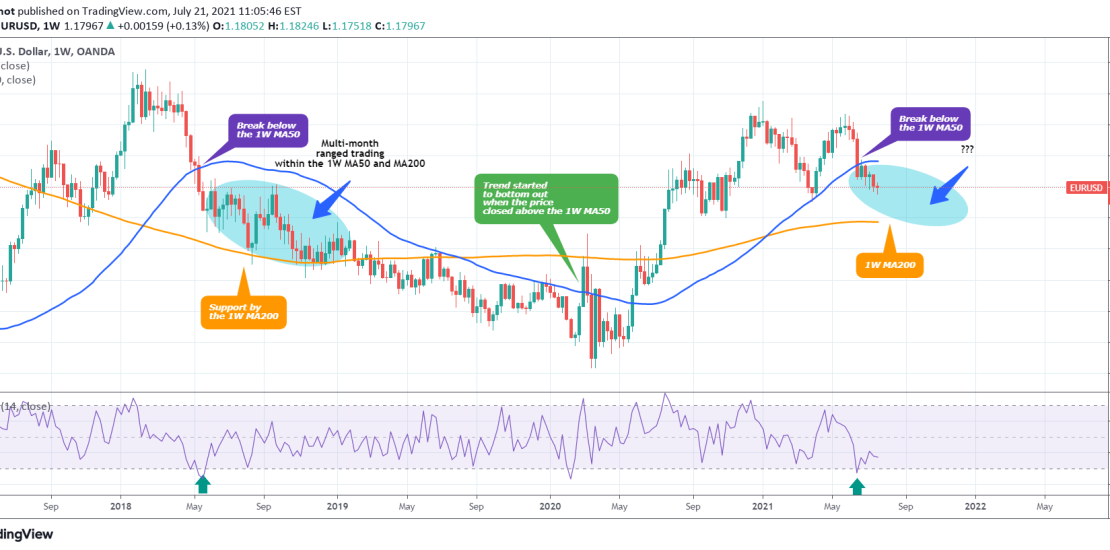
EURUSD has been trading below the 1W MA50 (blue trend-line) for the past 5 weeks. Even though it hasn’t broken below the 1.1700 – 1.1600 Suppor Zone that has been holding for exactly 1 year, it hasn’t traded below the 1W MA50 for that long since the May 2020 bullish break-out.
Last time we saw a similar break below the 1W MA50 after being higher that 1.2200 was back in May 2018 (even the 1D RSI is on similar levels). The price reached as low as the 1W MA200 (orange trend-line) and had a multi-month ranged trade between the 1W MA50 and 1W MA200 until it closed below the 1W MA200, which confirmed the continuation even lower. It only started to form the bottom after it closed a 1W candle above the 1W MA50.
As a result it is possible to see a similar MA range, unless the pair breaks and closes above the 1W MA50. Do you think it is more likely to continue lower or break above the 1W MA50 again?
Tradingview link:

