

- July 24, 2021
- Posted by: Tradingshot Articles
- Category: Cryptocurrency
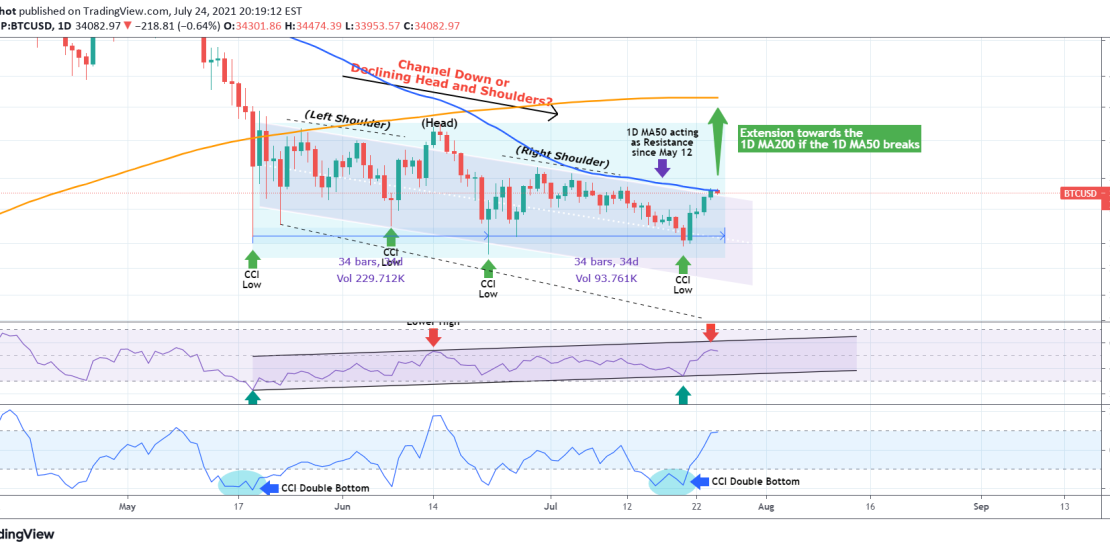
The title really says it all by itself. It is the first time that Bitcoin makes contact with the 1D MA50 (blue trend-line) since May 12, which was the start of the very aggressive 1 week sell-off that dived below 30k.
What is critical now is whether or not the price can close a 1D candle above the MA50, as so far yesterday’s candle failed to do so. A closing above should accumulate more buyers towards a 1D MA200 (orange trend-line) test, while a failure more sellers to another 30k test.
I’ve made a post 10 days ago on how the price action since May 19 could be seen as either a Channel Down (ignoring the wicks and June 13-16) or a Head and Shoulders on the decline and the importance of the CCI behind it. Yesterday the price broke above the Channel Down as it was coming off a strong rebound on a CCI Double Bottom. This also breaks the neckline of the Head and Shoulders. As a result, a 1D closing above the MA50 should convincingly invalidate those bearish patterns and restore the bullish sentiment at least for the short-term.
The RSI may be playing a key role in this. Since May 19 it has been on Higher Lows and Higher Highs (i.e. a Channel Up) which is diverging from the price action where (excluding the June 13-16 head formation) it has been on Lower Highs and Lower Lows (up until the recent Jul 20 low which was higher). This bullish divergence may be holding the key to this 2 month consolidation turning into a bottom sequence.
Keep in mind that, as discussed on that post, if this consolidation phase is fairly symmetrical with a mid-point the June 22 low, then it should break on Monday. Time will tell if this is confirmed or invalidated but so far there seem to be more bullish indicators than bearish for the first time in 2 months.
Also it is important to mention that the previous time BTC closed above the 1D MA50 following a 1D Death Cross was in mid April 2020 (check chart below), after the March 2020 COVID fueled sell-off. Since then, every break and close above the 1D MA50 started a strong rally. The exception was late June and mid July 2020 but the price only continued to trade sideways until the eventually rally. Since we had a1D Death Cross on June 19, we may be in a similar situation.
So what do you think? Will a closing above the 1D MA50 set a target on the 1D MA200? Feel free to share your work and let me know in the comments section!
Tradingview link: