
-
BITCOIN -20% correction in a day! Is the bleeding over?
- September 7, 2021
- Posted by: Tradingshot Articles
- Category: Cryptocurrency
No Comments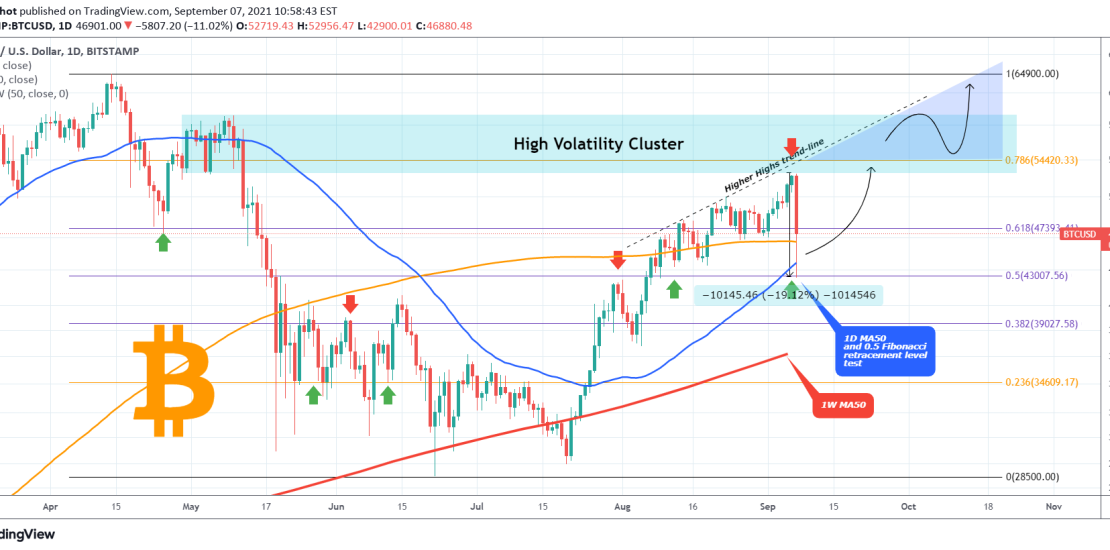
On my last Bitcoin analysis I underlined the importance that Fibonacci retracement levels along with the 1D MA50 (blue trend-line) will play on this recovery attempt. Today is a correction day for BTC with the price losing almost -20% intra day so far. The drop has been contained exactly on the 0.5 Fibonacci retracement
-
WTI OIL analysis on the 1D and 4H time-frames
- September 7, 2021
- Posted by: Tradingshot Articles
- Category: Commodities
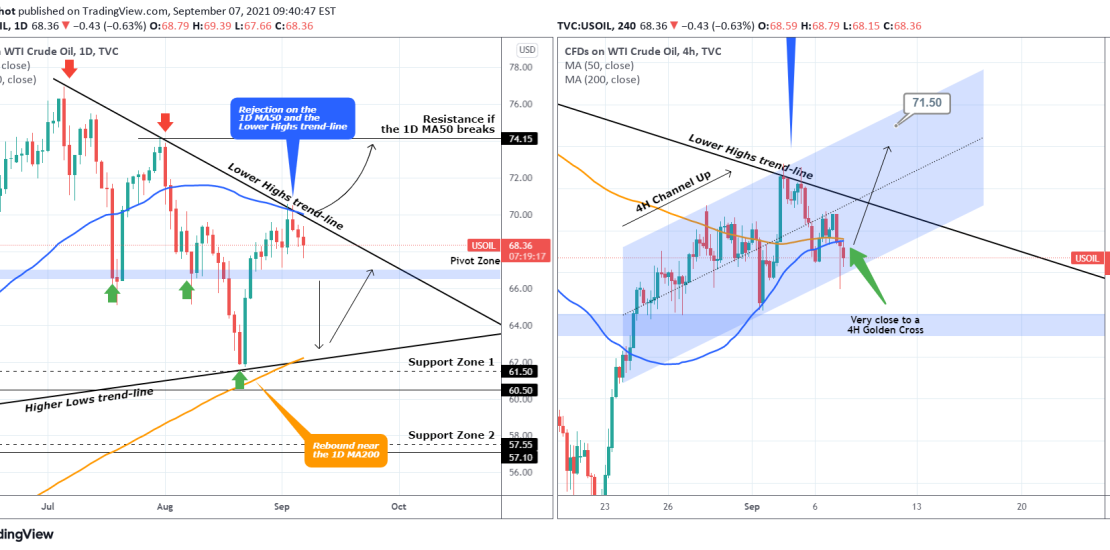
Last time I analyzed WTI Oil on August 24, I made it clear that it was trading within a long-term Triangle and until it broke, its price action would be sideways: I stressed out the importance of the 1D MA50 (blue trend-line) and the Lower Highs trend-line of that Triangle. Well as you see
-
S&P broke the 4H MA50. Starting the correction.
- September 7, 2021
- Posted by: Tradingshot Articles
- Category: Uncategorized
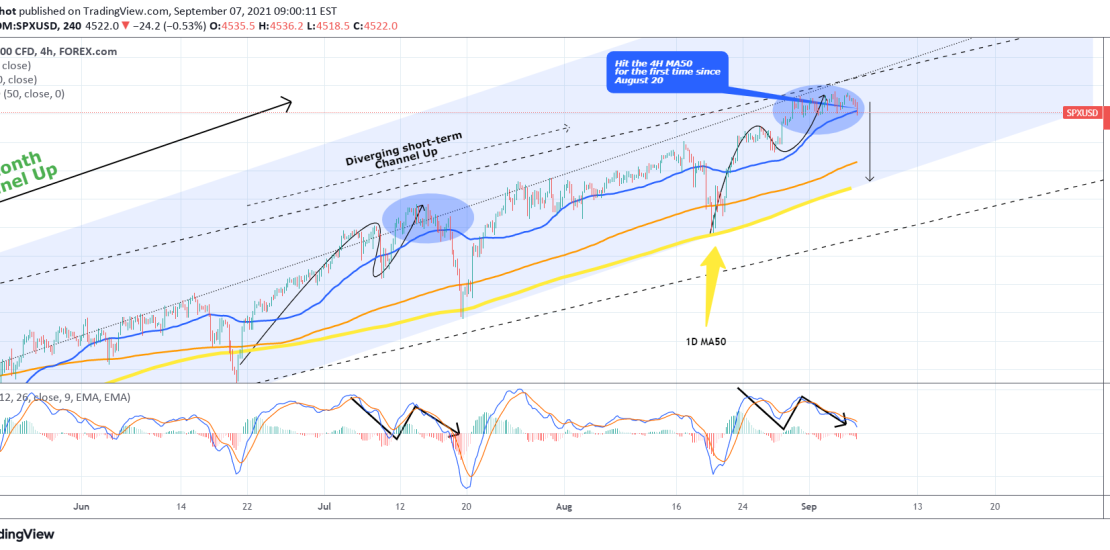
Pattern: Channel Up on 4H. Signal: Sell as the price broke below the 4H MA50 (blue trend-line) for the first time since August 20. Also the price action and the MACD is similar to the July 15 consolidation which also led to a pull-back below the 4H MA50. Target: The 1D MA50 (yellow trend-line),
-
XAUUSD broke above the 1W MA50 for the 1st time since June!
- September 3, 2021
- Posted by: Tradingshot Articles
- Category: Commodities
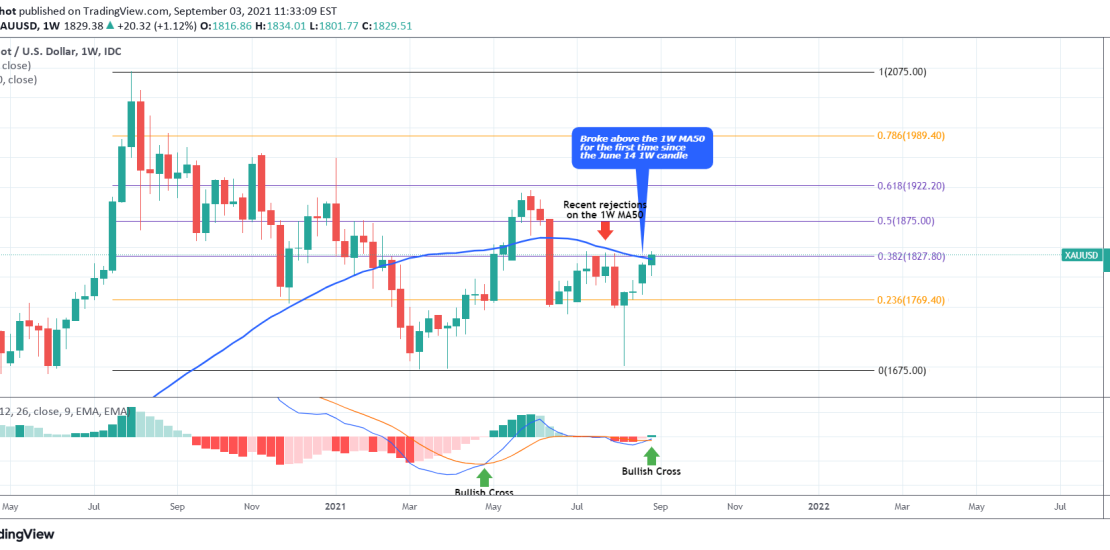
My most recent Gold signal was on the short-term time-frame of 4H: This time we have a significant technical development on long-term and I’ve moved us to the 1W time-frame where XAUUSD just broke above the 1W MA50 (blue trend-line) for the first time since the June 14 weekly candle. Closing the week above
-
XAUUSD Golden Cross formed on 4H
- August 31, 2021
- Posted by: Tradingshot Articles
- Category: Commodities
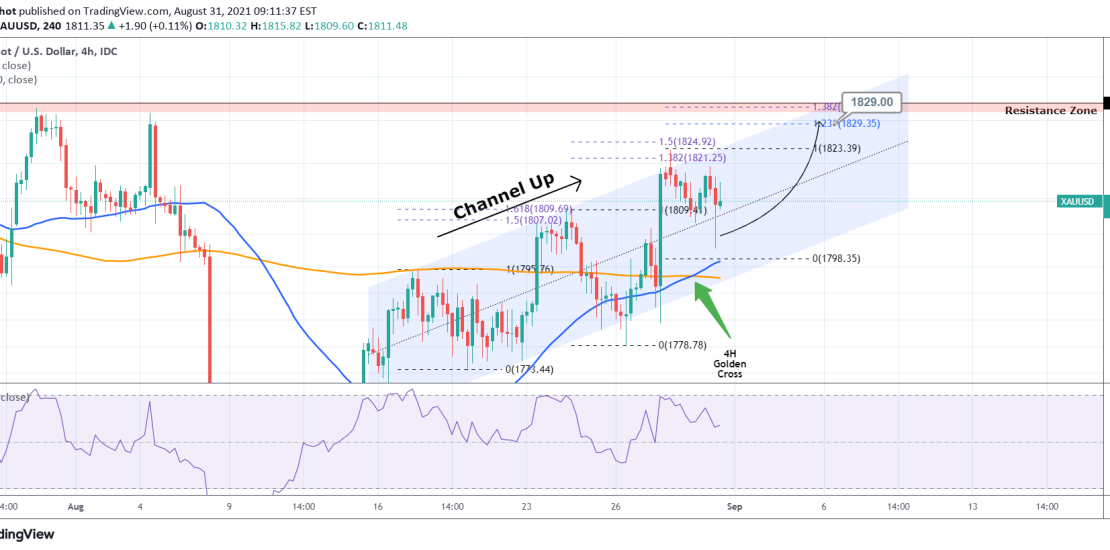
Pattern: Channel Up on 4H. Signal: Buy as the price rebounded near the 4H MA50 (blue trend-line) and even though there is still room within the Channel for one last low, the 4H Golden Cross that was formed may bring higher prices without it. Target: 1829 (just below the 1.236 Fibonacci retracement level and
-
WTI OIL had the biggest weekly rise since May 31 2020!
- August 31, 2021
- Posted by: Tradingshot Articles
- Category: Commodities
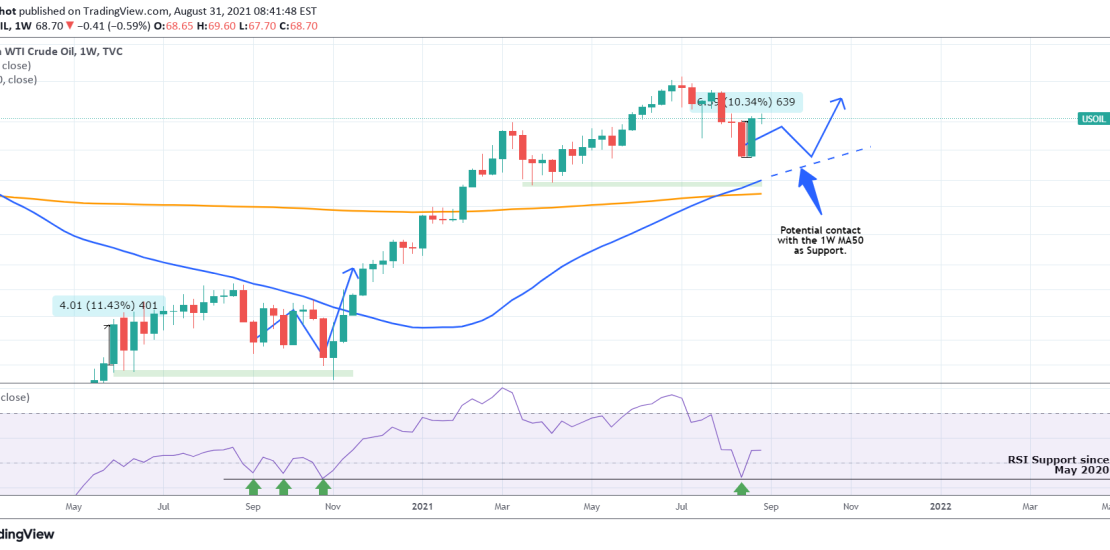
WTI Crude Oil posted last week the strongest 1W candle (+10.30%) since May 31 2020 (+11.44%). What can this possibly mean for future prices? Alone nothing. But as you see, last week’s bounce came after a 1W RSI touch on the 43.50 Support which has been holding since May 2020 as well. That makes
-
BITCOIN fun fractal.. or something more?
- August 28, 2021
- Posted by: Tradingshot Articles
- Category: Cryptocurrency
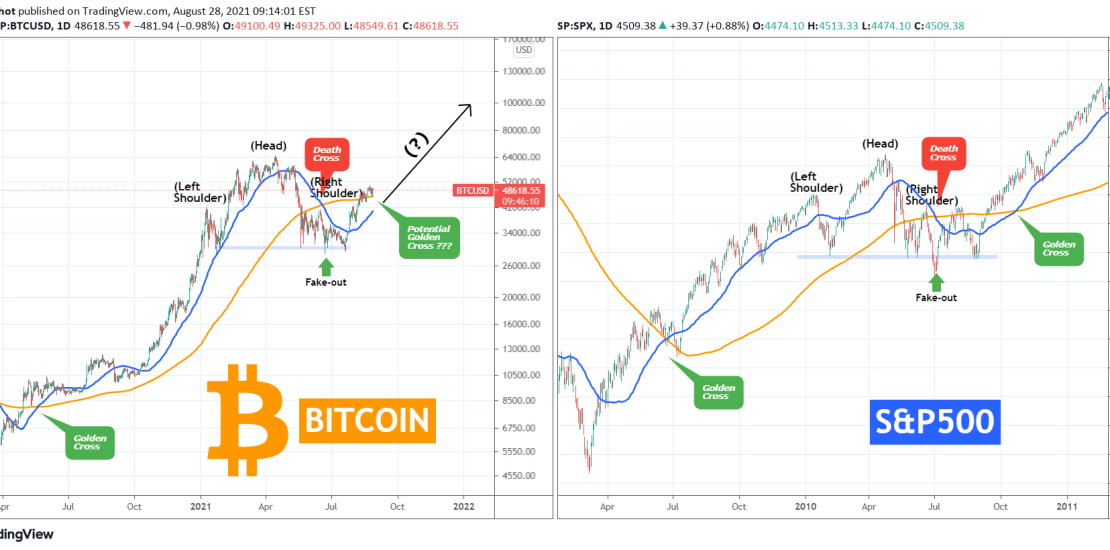
Those who follow me since my start here on TradingView or even way back on Reddit know that I am a big fun fractal comparison. I have been using this approach extensively especially on long-term technical analysis and more often than not, proves to be quite efficient. The fractal comparison I am bringing to you
-
WTI OIL aiming at the 1D MA50
- August 24, 2021
- Posted by: Tradingshot Articles
- Category: Commodities

Pattern: Triangle on 1D. Signal: Buy as the price (a) made a strong rebound on the Higher Lows trend-line, (b) near the 1D MA200 (orange trend-line) and (c) broke above the Pivot Zone. Target: The 1D MA50 (blue trend-line). Tradingview link: https://www.tradingview.com/chart/USOIL/X7DQLRmq-WTI-OIL-aiming-at-the-1D-MA50
-
XAUUSD They symmetrical harmony of Fibonacci levels
- August 24, 2021
- Posted by: Tradingshot Articles
- Category: Commodities
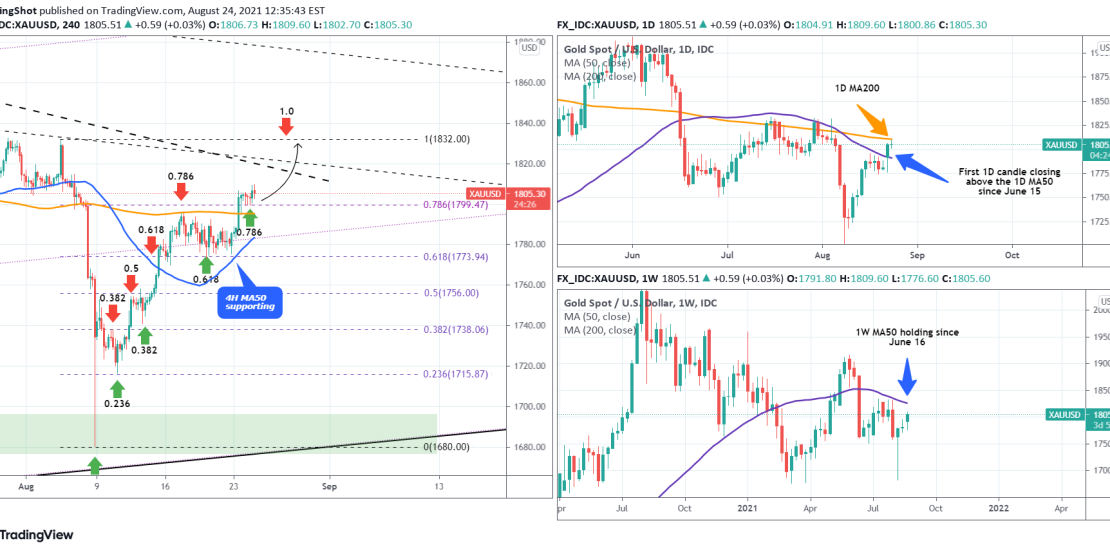
In my most recent Gold idea I introduced the importance of the Fibonacci retracement levels as targets following the August 08 flash crash of the Nonfarm Payrolls: As you see since then, the Fibs have acted very well as Resistance levels which on the following pull-backs acted as Supports. As the 0.786 Fib is
-
GBPJPY Major Resistance from 2007!
- August 12, 2021
- Posted by: Tradingshot Articles
- Category: Forex
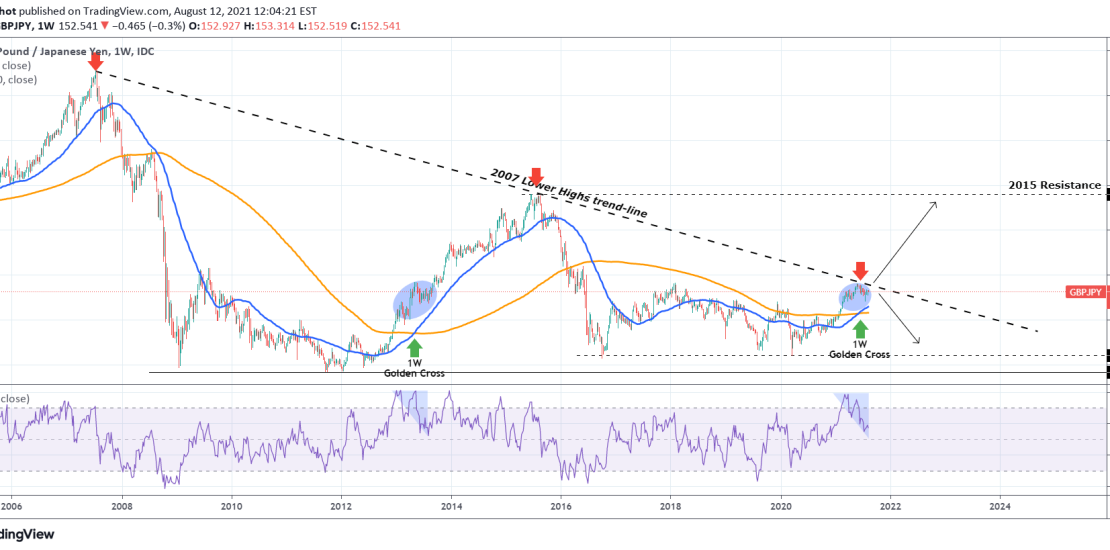
GBPJPY is ahead of a “Make or break” situation as it is facing the Lower Highs trend-line that started all the way back from the 2007 subprime mortgage crisis. As long as it holds, the pair will most likely reverse back towards the lower Support levels. However if the 2007 line breaks, then it
