

2023 March
-
BITCOIN The party has started and has another 33 months left!
- March 17, 2023
- Posted by: Tradingshot Articles
- Category: Cryptocurrency
No Comments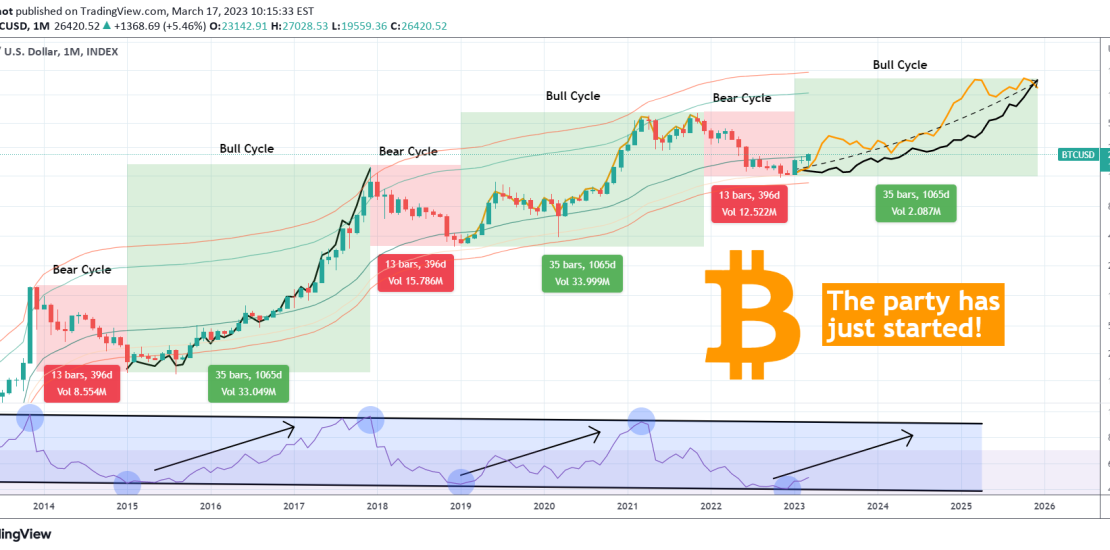
Bitcoin (BTCUSD) gives us a very clear picture with regards to its long-term Cycles on the 1M (monthly) time-frame. As you see, once the 1M RSI hit the bottom (Lower Lows trend-line) of its 10 year Channel Down, BTC bottomed and the new Bull Cycle started. This Bull Cycle should last for approximately 35 months
-
DOW JONES is forming a bottom, aiming at the 1D MA50 again.
- March 16, 2023
- Posted by: Tradingshot Articles
- Category: Stock Indices
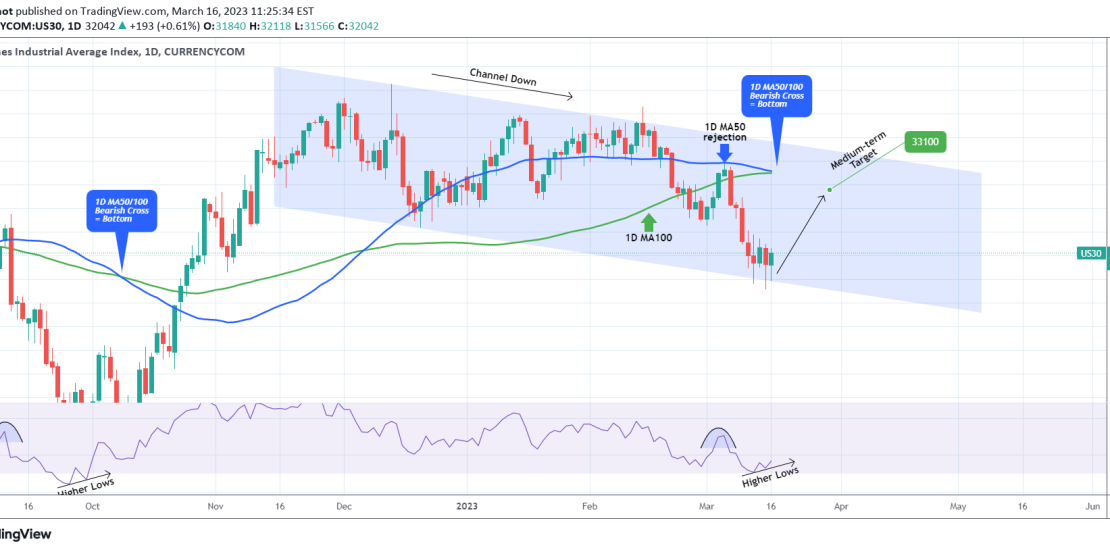
Dow Jones (DJI) is trading sideways for the 4th straight 1D candle on the bottom (Lower Lows trend-line) of the long-term Channel Down. As the 1D RSI touched the 30.00 oversold level and rebounded, similar to the September 27 bottom, while the 1D MA50 (blue trend-line) crossed below the 1D MA100 (green trend-line) to form
-
WTI OIL Excellent long-term buy opportunity.
- March 16, 2023
- Posted by: Tradingshot Articles
- Category: Commodities
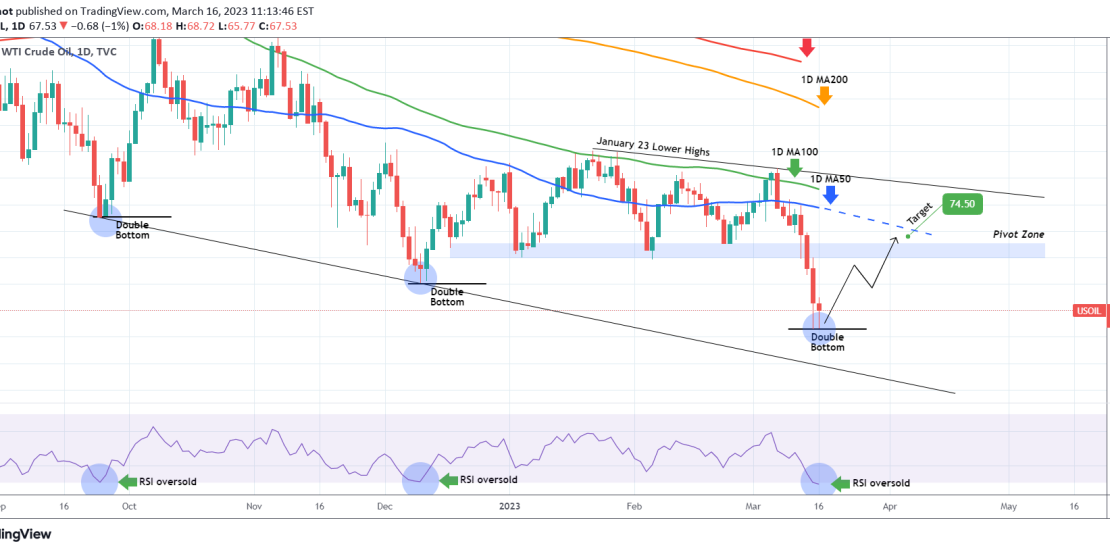
WTI Oil (USOIL) got its 1D RSI oversold below 30.00 as the market made a new Low since December 09. The last two times the 1D RSI was that low was on the medium-term (Lower) Lows of December 09 and September 26. This is a strong buy signal as every time the Low was priced,
-
EMERGING MARKETS 7 year bottom is in. Huge upside potential.
- March 16, 2023
- Posted by: Tradingshot Articles
- Category: Uncategorized
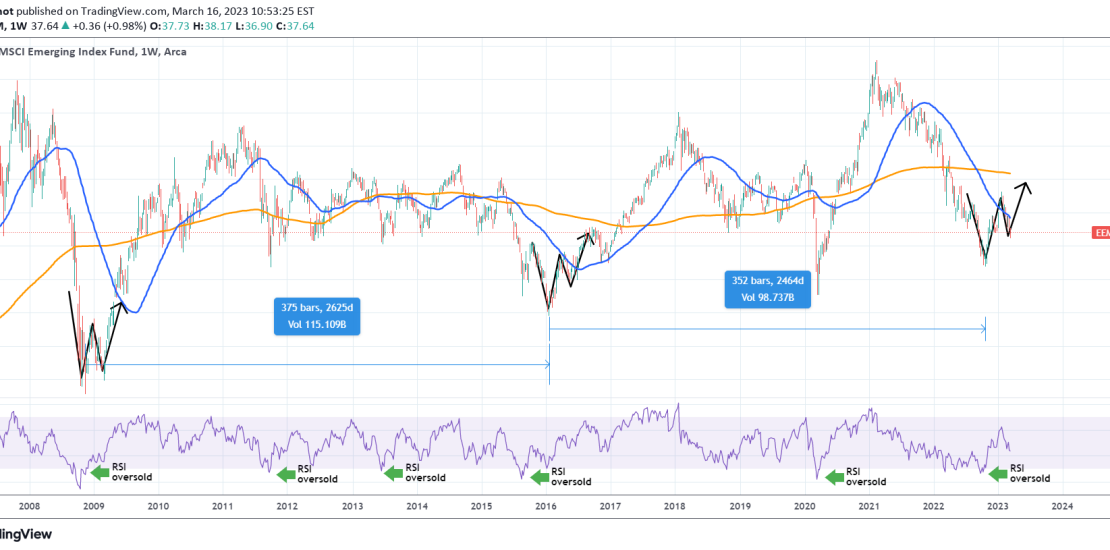
The MSCI Emerging Index Fund (EEM) is posting a bottom rebound pattern similar to early 2016 and 2009. All all cases the 1W RSI previously broke below the 30.00 oversold level and rebounded strongly. As you see these bottoms take place approximately every 7 years. This indicates that the Emerging Markets are only at the
-
BITCOIN The S&P/GOLD ratio is leading the way!
- March 16, 2023
- Posted by: Tradingshot Articles
- Category: Cryptocurrency
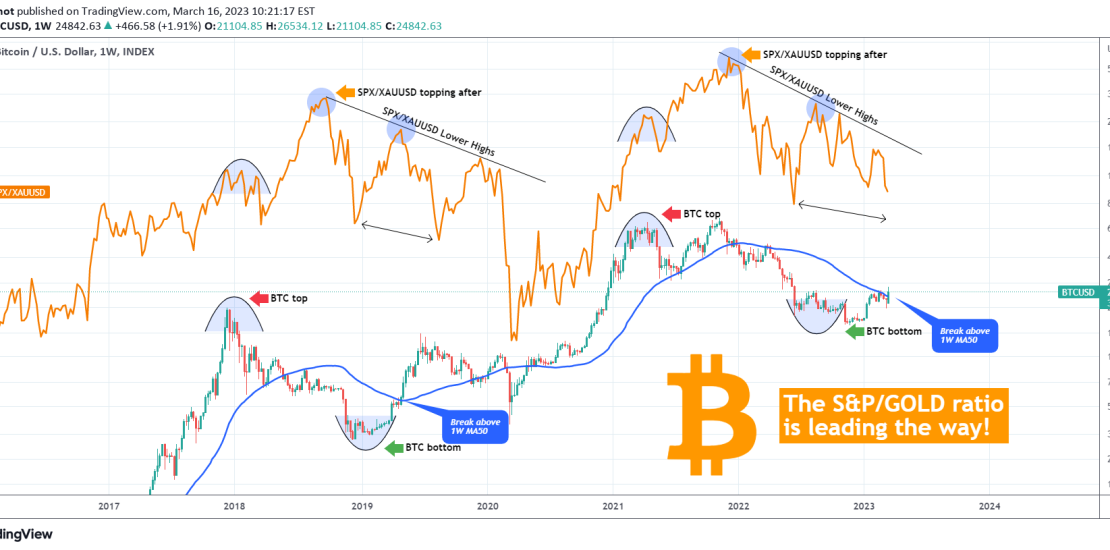
This is a unique study showing the correlation of Bitcoin (BTCUSD) with the S&P500/Gold ratio (SPX/XAUUSD) displayed by the orange trend-line. On this 1W time-frame, Bitcoin has broken above the 1W MA50 (blue trend-line) and will attempt to make the first closing above it, in order to confirm the new Bull Cycle beyond any doubt.
-
EUROSTOXX has incredible upside potential.
- March 15, 2023
- Posted by: Tradingshot Articles
- Category: Forex
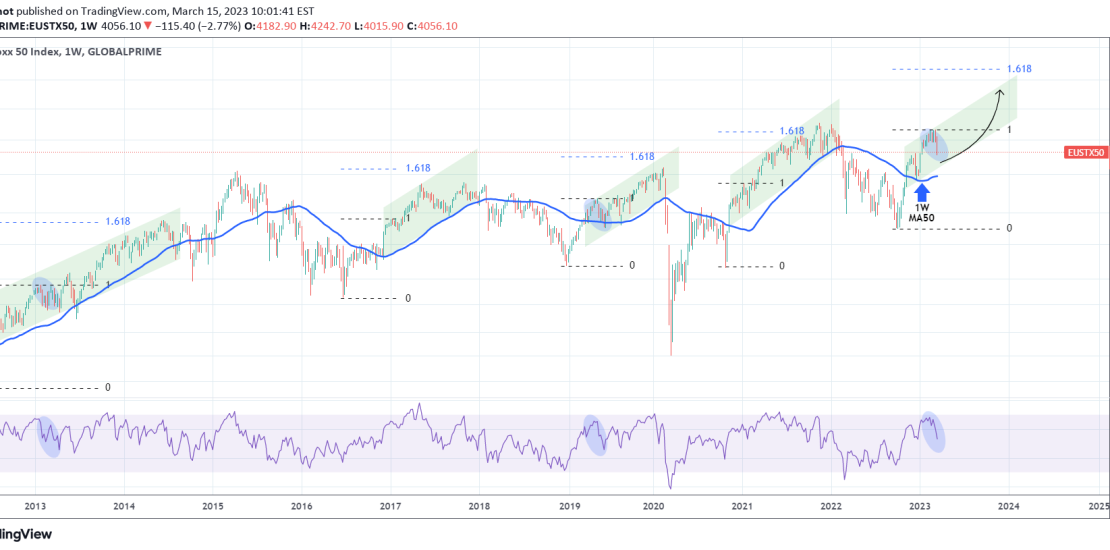
An often overlooked index, the EURSTOXX has been on a rising 1W MA50 (blue trend-line) since late January. This is a major Bull rally continuation signal as it matches the pattern of four prior uptrends of the past 10 years. The 1W RSI has turned neutral and during Bull Cycles, this is always a strong
-
EURUSD Clear multi-month buy based on the annual Cycles.
- March 15, 2023
- Posted by: Tradingshot Articles
- Category: Forex
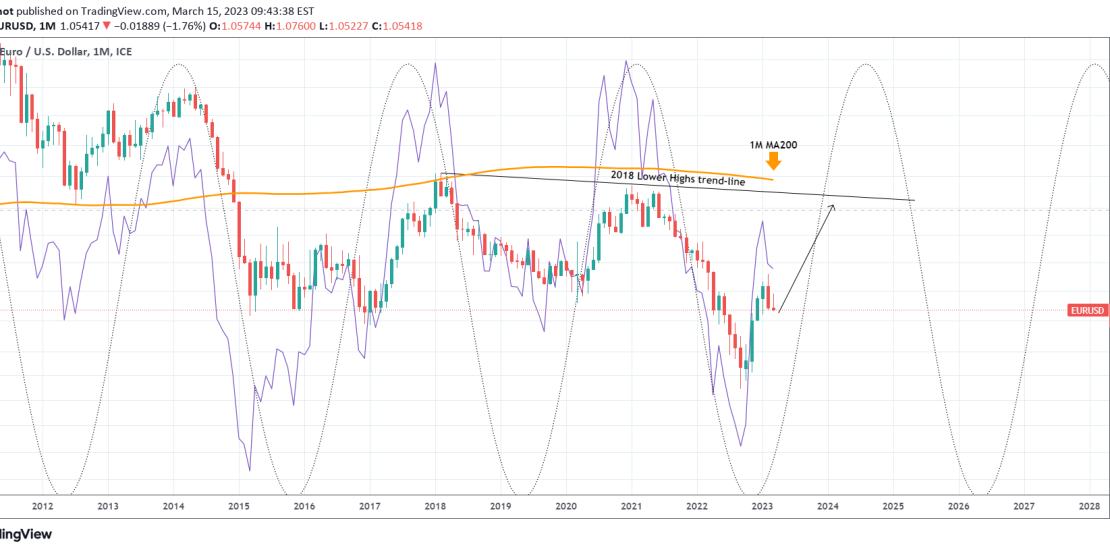
The decline on the EURUSD pair since the February High is having many lose sight of the long-term trend. As we called back in September, the pair was at or near a Cyclical Bottom. This chart on the 1M (monthly) time-frame helps at better understanding its long-term Cycles in the span of a decade. The
-
US02Y is on a breaking point. Great news for stocks!
- March 14, 2023
- Posted by: Tradingshot Articles
- Category: Other
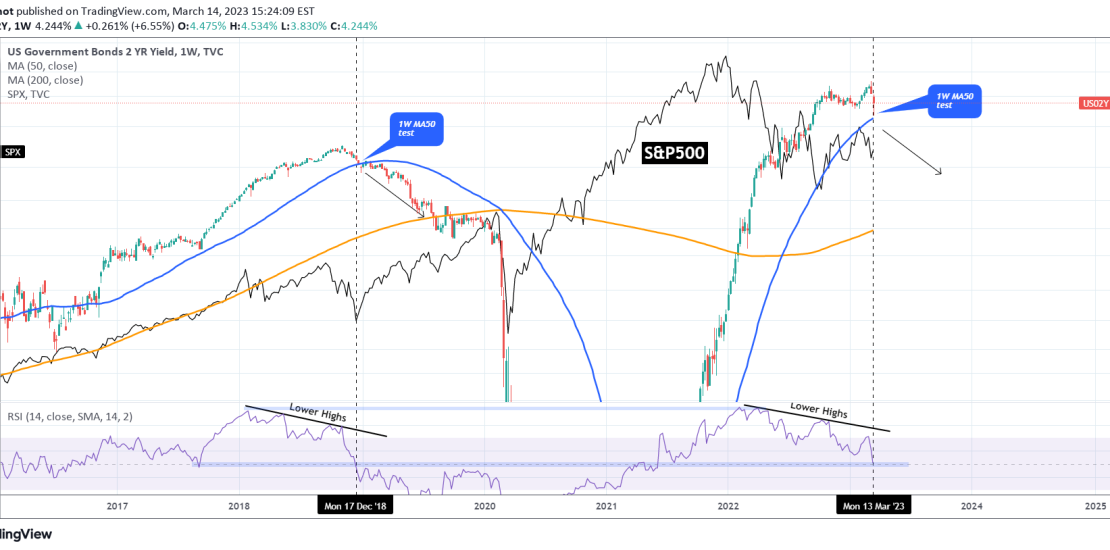
The U.S. Government Bonds 2 YR Yield (US02Y) is testing its 1W MA50 (blue trend-line) for the first time since May 31 2021. The 1W RSI is on the very same Lower Highs trend-line rejection that it was during the December 17 2018 1W MA50 test! Needless to say this shows that the price is
-
S&P500 is accumulating for a 2 year rally to 5700.
- March 14, 2023
- Posted by: Tradingshot Articles
- Category: Stock Indices
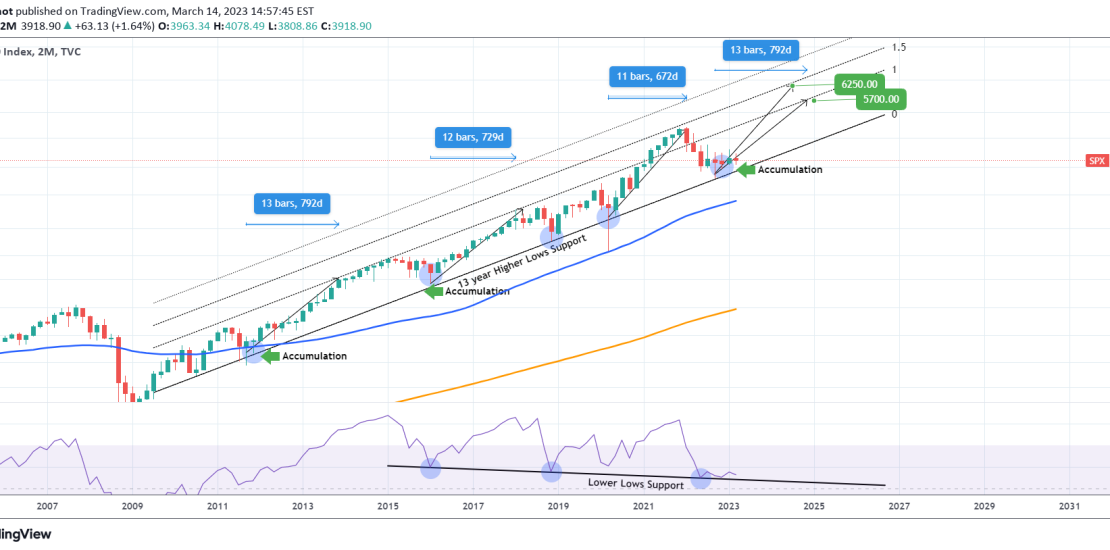
We have showed you this multi-year Channel Up on the S&P500 index (SPX) before. We have shown you the Lower Lows Support of the 2M RSI that has caught all major bottoms since 2016. What this chart shows is that the index has bottomed on the Channel’s Higher Lows (a 13 year trend-line) and is
-
DOW JONES Don’t get confused.It’s starting a new multiyear rally
- March 14, 2023
- Posted by: Tradingshot Articles
- Category: Stock Indices
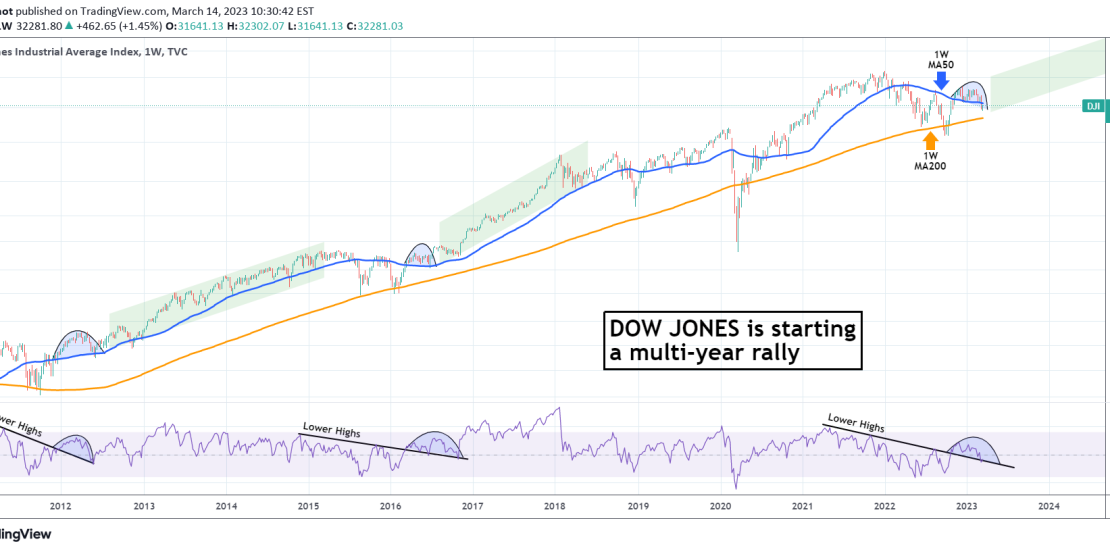
This is a chart we’ve looked into in the recent past for Dow Jones (DJI) but amidst the recent uncertainty, we think it is necessary to refresh in order to keep things into a longer term perspective. The time-frame is the 1W (weekly) where Dow is seen forming an Arc pattern on the 1W MA50