

- March 15, 2023
- Posted by: Tradingshot Articles
- Category: Forex
No Comments
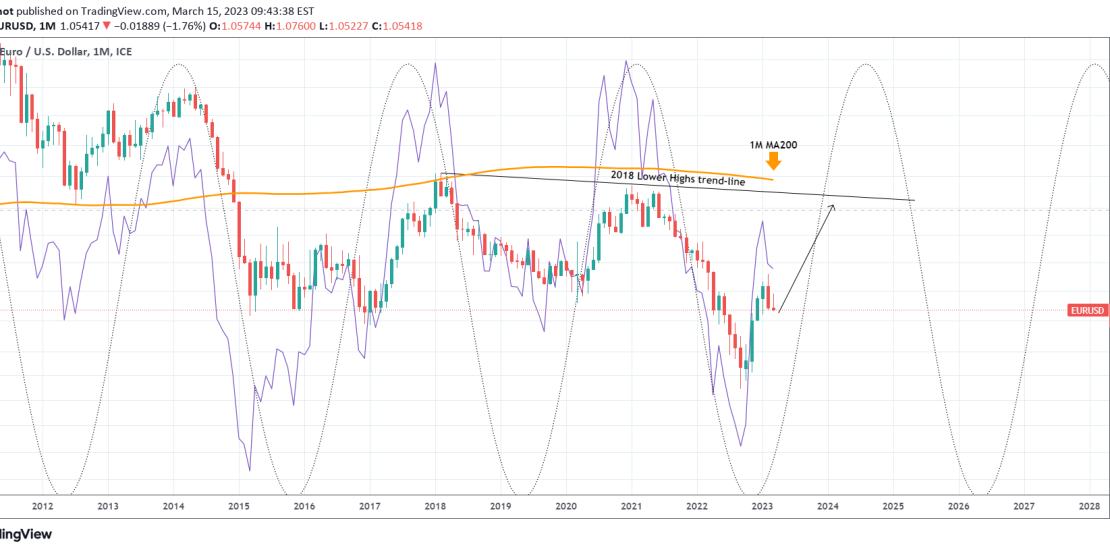
The decline on the EURUSD pair since the February High is having many lose sight of the long-term trend. As we called back in September, the pair was at or near a Cyclical Bottom. This chart on the 1M (monthly) time-frame helps at better understanding its long-term Cycles in the span of a decade.
The blue trend-line is the 1M RSI and the orange is the 1M MA200. As you see, the pair isn’t even half-way through its new Bull Cycle. The top is expected at or near the 2018 Lower Highs trend-line, which is almost moving parallel with the 1M MA200. Based on this recurring pattern, a 1.2000 long-term price tag on EURUSD isn’t at all unrealistic.
Tradingview link: