

2023 March
-
CHFJPY on a critical Support from 2021
- March 22, 2023
- Posted by: Tradingshot Articles
- Category: Forex
No Comments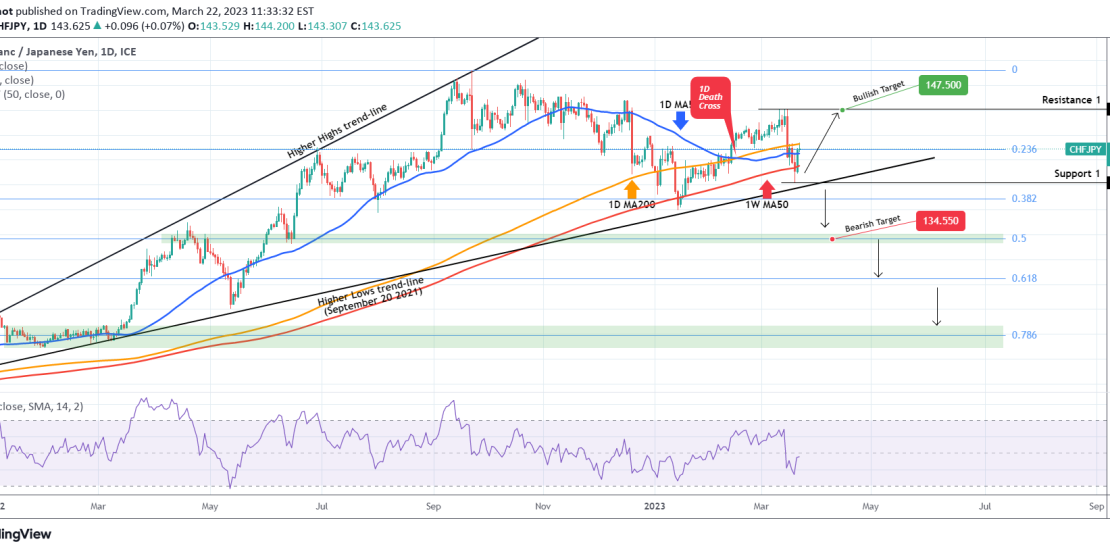
The CHFJPY pair almost made contact 2 days ago on the September 20 2021 Higher Lows trend-line and is so far seen rebounding. So far today this is contained on the 1D MA200 (orange trend-line). As long as Support 1 (140.200) holds, we are buying targeting just below Resistance 1 at 147.500. If the Higher
-
AUDJPY Testing the 2-year Higher Lows Zone.
- March 22, 2023
- Posted by: Tradingshot Articles
- Category: Forex
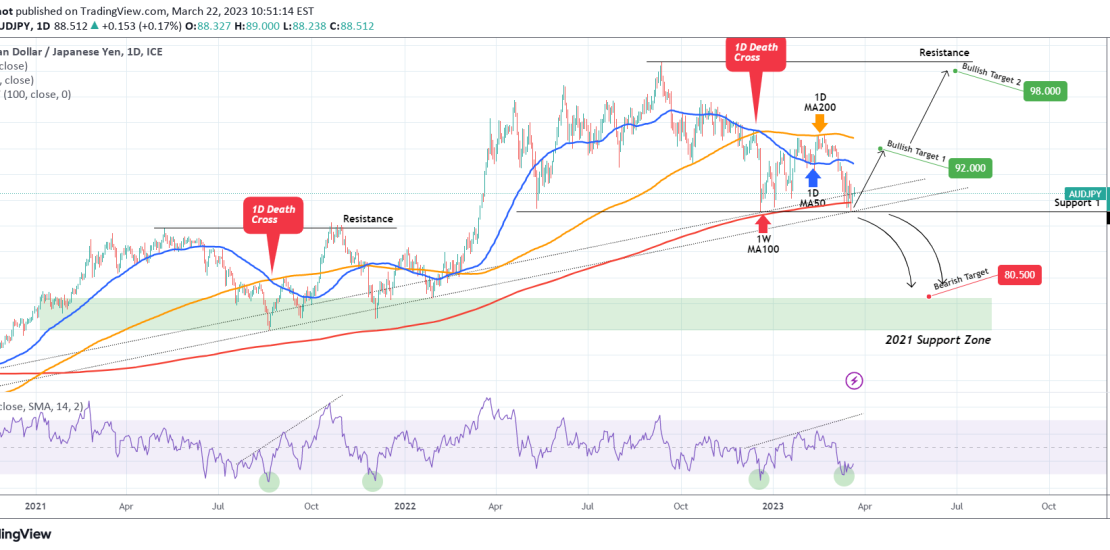
The AUDJPY pair hit last week the 1W MA100 (red trend-line) for the first time since November 04 2020, while entering the Higher Lows (dotted) Zone that started around the same time. As you understand this is a critical Support cluster, considering that Support 1 (87.100) is also holding. If broken, we will sell aiming
-
GOLD’s and BITCOIN’s correlation. BTC about to drop?
- March 21, 2023
- Posted by: Tradingshot Articles
- Category: Cryptocurrency
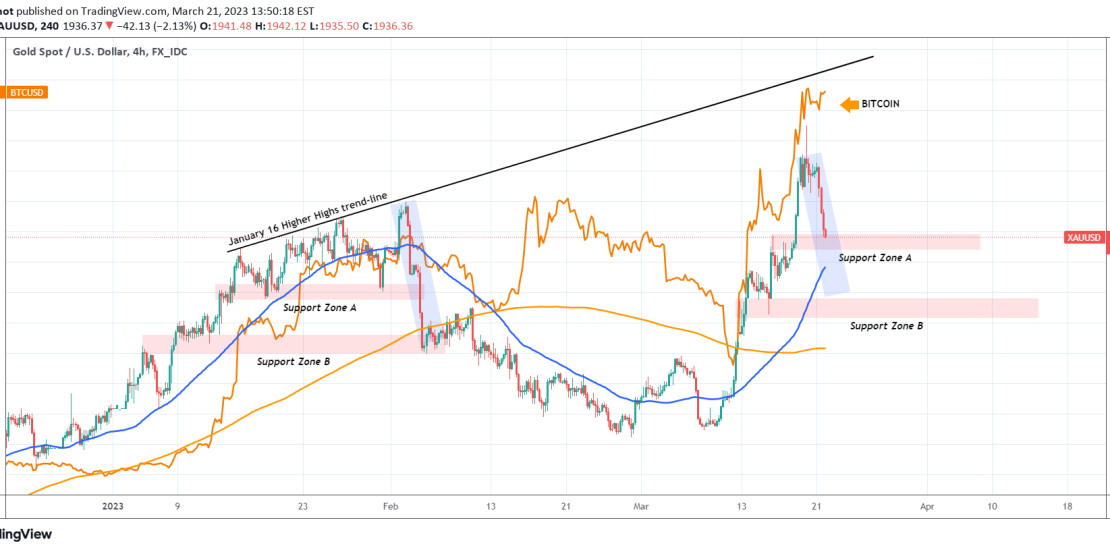
This is a chart displaying Gold’s (XAUUSD) correlation with Bitcoin (BTCUSD) on the short/ medium-term. As you see the two have been tightly correlated since late last year. When Gold started dropping aggressively after the February 02 High, Bitcoin followed shortly, though with not such an aggressive note. With Gold declining rapidly today, is this
-
DAX is starting a long-term rally to 16100
- March 21, 2023
- Posted by: Tradingshot Articles
- Category: Stock Indices
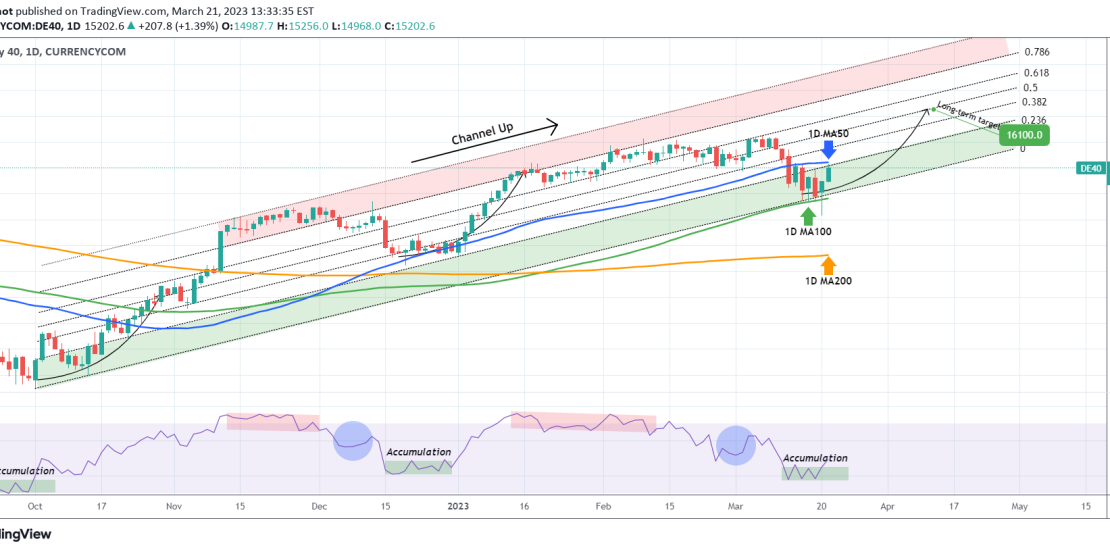
DAX is now testing the 1D MA50 (blue trend-line) having rebounded at the bottom of its long-term (since the October 03 Low) Channel Up and the 1D MA100 (green trend-line). With the 1D RSI coming out of its Accumulation Zone, as in the previous two Lows (late September and late December 2022), we expect this
-
DOW JONES has started the new bullish wave.
- March 21, 2023
- Posted by: Tradingshot Articles
- Category: Stock Indices
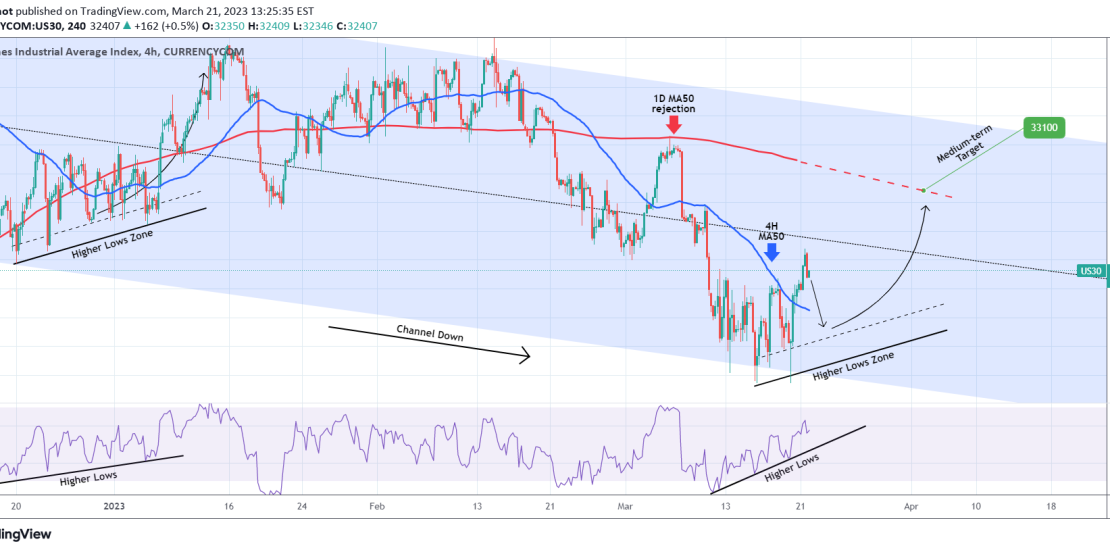
This is basically to last week’s buy signal at the bottom: As you see Dow Jones (DJI) made a new Lower Low (bottom) on the 4-month Channel Down and broke above the 4H MA50 (blue trend-line) again. The move is supported by a Higher Lows Zone (as is the RSI), similar to the previous Channel
-
WTI OIL Inverse Head and Shoulders cementing the bottom.
- March 21, 2023
- Posted by: Tradingshot Articles
- Category: Commodities
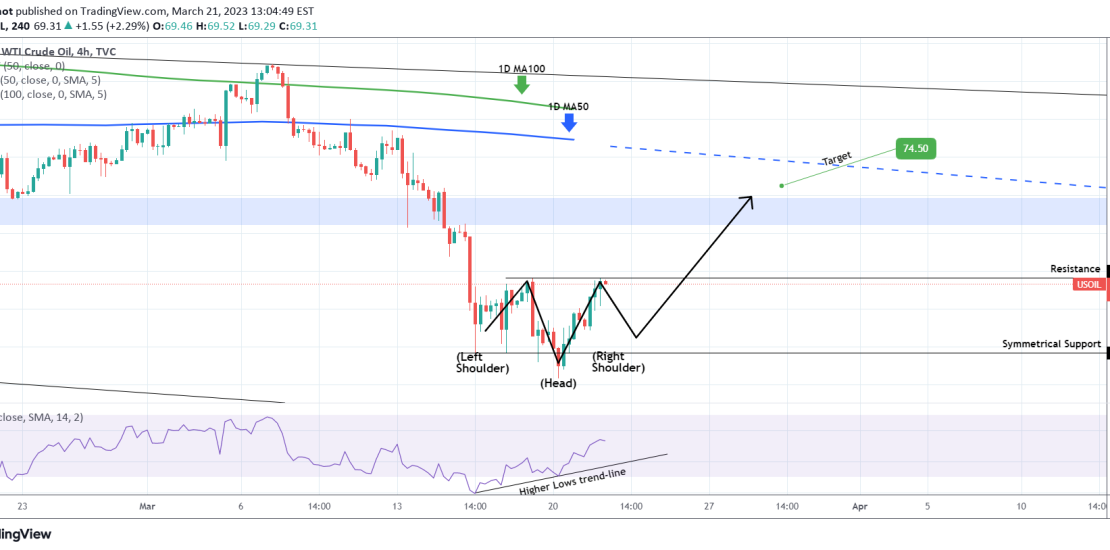
WTI Oil (USOIL) is forming an Inverse Head and Shoulders (IH&S) pattern on the 4H time-frame, which is a technical bottom and bullish reversal formation. The 4H RSI is on a Higher Lows trend-line, indicating an uptrend and already above the 50.00 neutral mark. One last pull-back to the 65.70 Symmetrical Support is possible, before
-
S&P500 Best buy signal since early January.
- March 20, 2023
- Posted by: Tradingshot Articles
- Category: Stock Indices
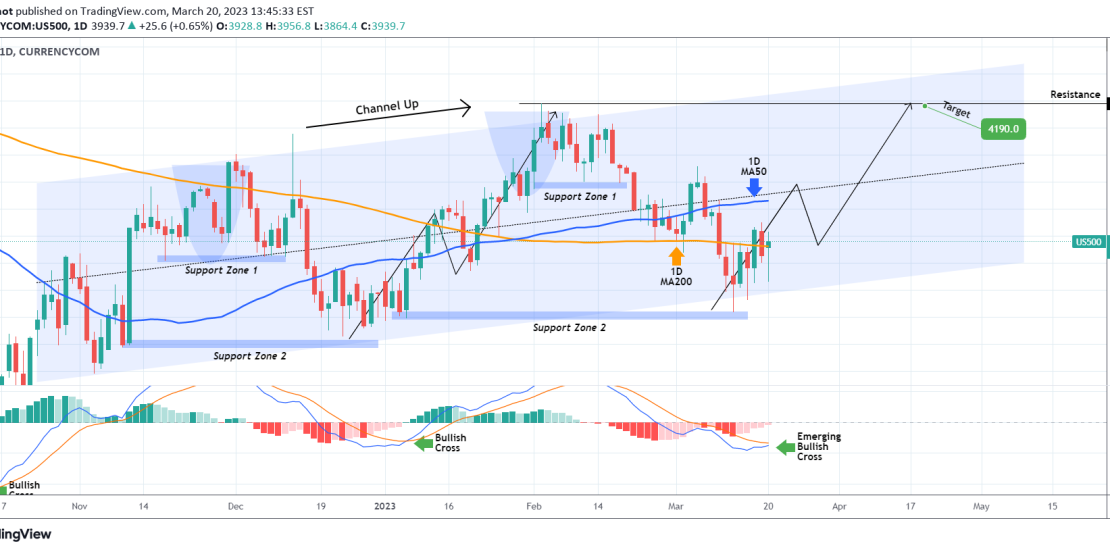
The S&P500 index (SPX) is on a 1 week rebound following the March 13 Low which was made on Support Zone 2 and is so far on the bottom of the 5-month Channel Up. All candles have closed inside this pattern and as you see so far every bearish and bullish wave follows similar structure
-
DXY Huge H&S about to break downwards aggressively
- March 17, 2023
- Posted by: Tradingshot Articles
- Category: Forex
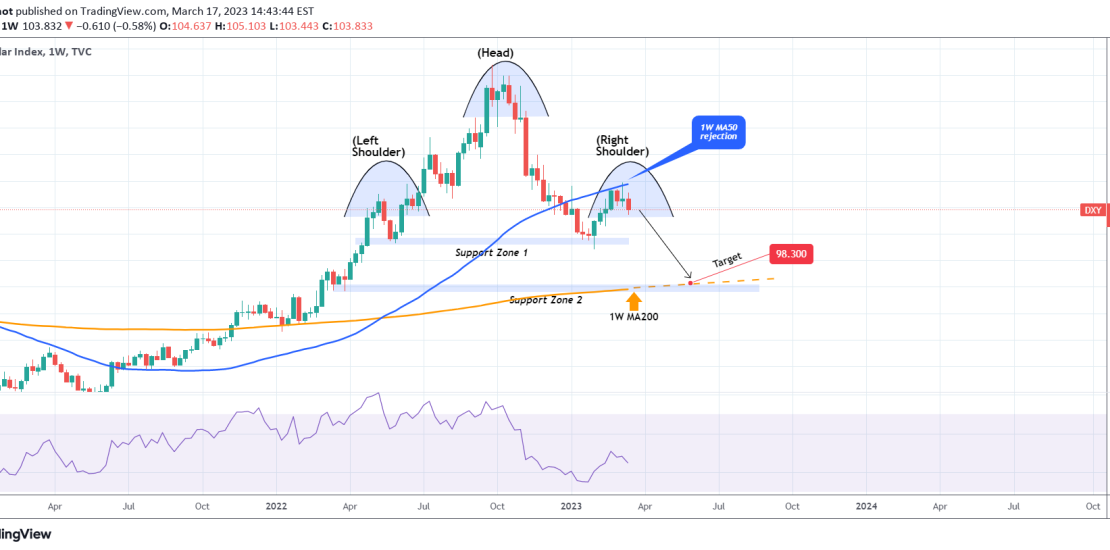
The U.S. Dollar Index (DXY) has hit our first short-term target as presented on our most recent analysis: The major news however is that it failed to break above its 1W MA50 (blue trend-line) where in fact it got rejected last week. This validates the giant Head and Shoulders (H&S) idea we discussed in the
-
NASDAQ flipped the Bear Cycle and the 1D MA200 is now supporting
- March 17, 2023
- Posted by: Tradingshot Articles
- Category: Stock Indices
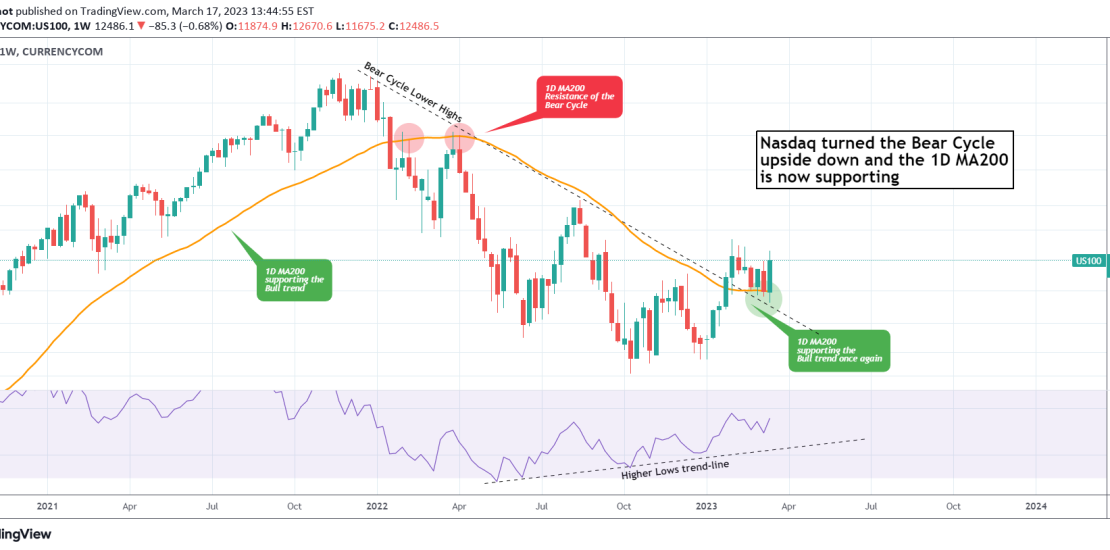
Nasdaq (NDX) rebounded yet another week on the Bear Cycle Lower Highs trend-line and has recovered all the losses of the previous three. On top of that, this is the 7th straight 1W candle close above the 1D MA200 (orange trend-line), which as you see on this 1W chart, it was been the Resistance during