

- March 16, 2023
- Posted by: Tradingshot Articles
- Category: Cryptocurrency
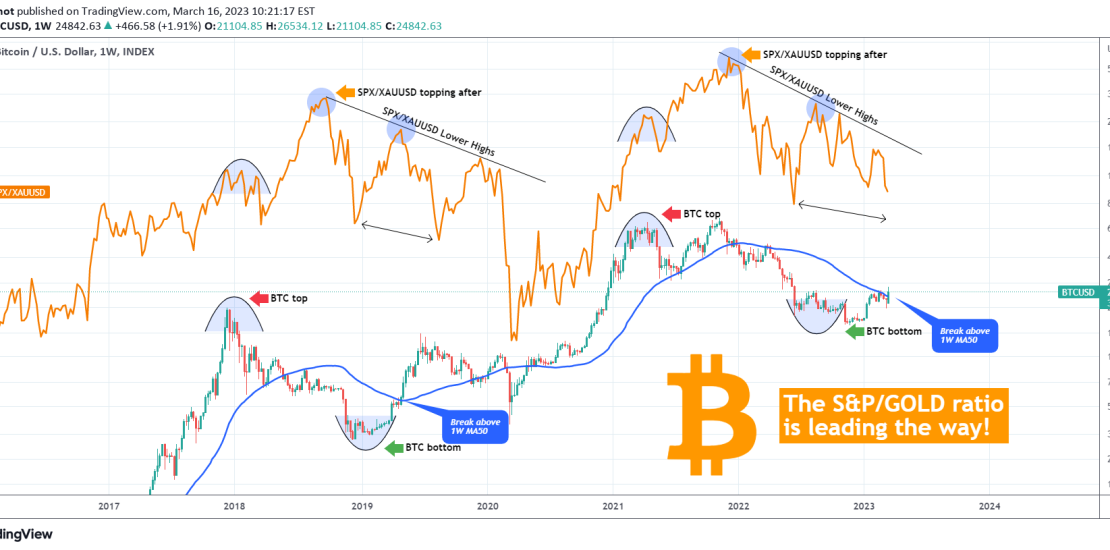
This is a unique study showing the correlation of Bitcoin (BTCUSD) with the S&P500/Gold ratio (SPX/XAUUSD) displayed by the orange trend-line.
On this 1W time-frame, Bitcoin has broken above the 1W MA50 (blue trend-line) and will attempt to make the first closing above it, in order to confirm the new Bull Cycle beyond any doubt. In the previous Cycle this took place on the week of April 29 2019.
As you can see, the patterns between the two Cycles are identical. Bitcoin tends to peak earlier when the S&P500/Gold ratio makes its last Higher High before it eventually tops after BTC is well within its Bear Cycle. The S&P500/Gold ratio then forms a series of Lower Highs, the second of which is when BTC bottoms (excluding the FTX crash, that would have been the bottom). At the moment we are expecting a Lower Low on the S&P500/Gold ratio in order to price the first High of the first rally of the new Bull Cycle.
Do you think the S&P500/Gold ratio is leading the way for Bitcoin? Feel free to let us know in the comments section below!
Tradingview link:
https://www.tradingview.com/chart/BTCUSD/L26bhEoV-BITCOIN-The-S-P-GOLD-ratio-is-leading-the-way