

2023 February
-
NASDAQ hit the 6-month symmetrical Support. Potential rebound.
- February 24, 2023
- Posted by: Tradingshot Articles
- Category: Stock Indices
No Comments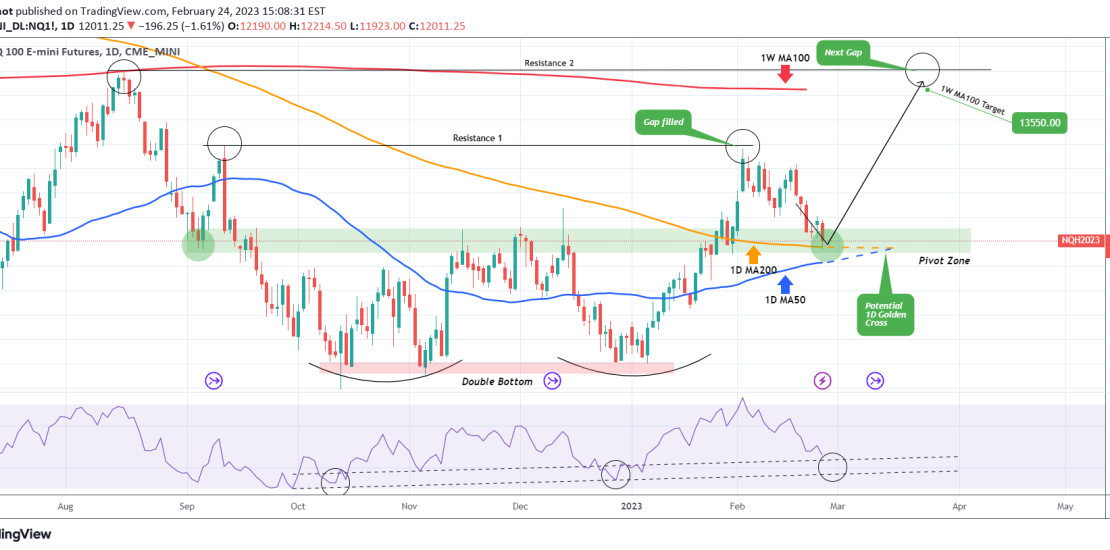
In our last Nasdaq (NDX) analysis 10 days ago, we called for a short-term correction after the price already filled the Gap of Resistance 1 (12985) and started making Lower Highs: Our target was the 6-month Pivot Zone, which is a symmetrical liquidity level, Support in early September and Resistance in mid November to mid
-
WTI OIL Two break-out buy signals
- February 24, 2023
- Posted by: Tradingshot Articles
- Category: Commodities
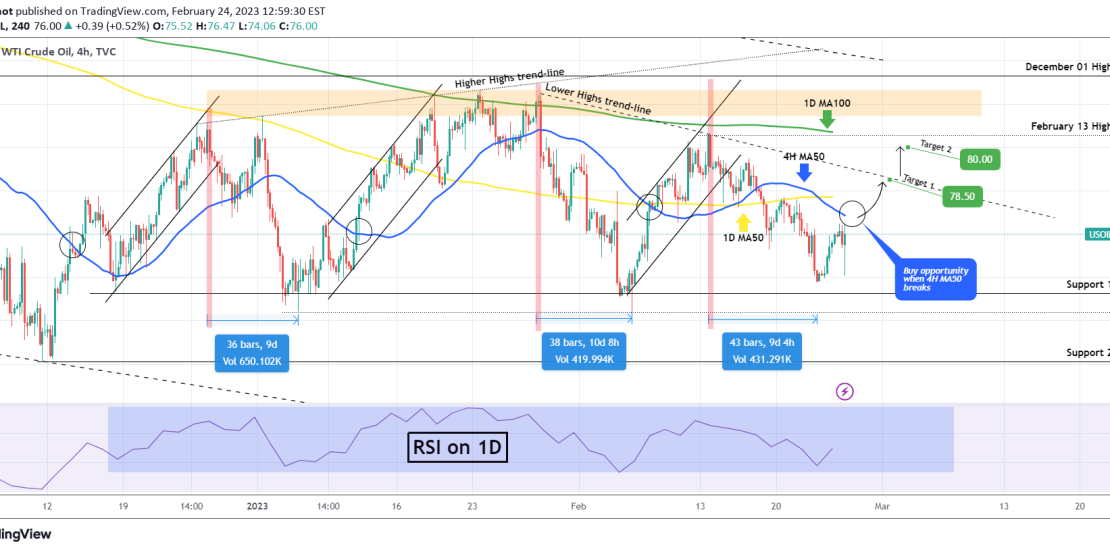
11 days ago we took the best possible sell entry we could have as we shorted the exact top, calling for the best sell opportunity since December: Right now the price is on a strong rebound, slightly higher than Support 1 (73.25) but with the 1D RSI on a confirmed reversal within its range. If
-
XAUUSD Major Support Cluster approaching. Strong buy.
- February 24, 2023
- Posted by: Tradingshot Articles
- Category: Commodities
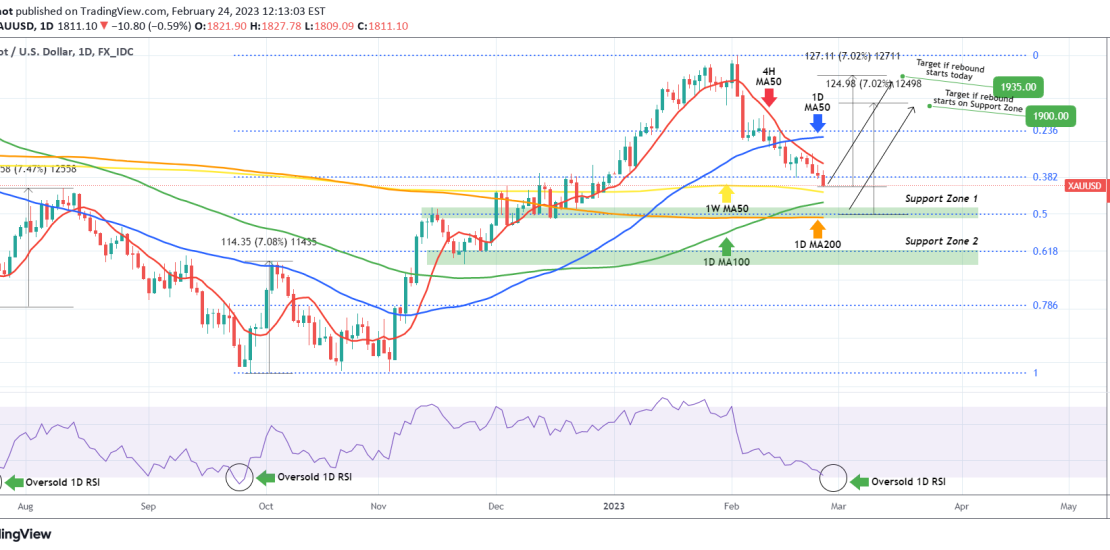
Gold (XAUUSD) is about to test the 1W MA50 (yellow trend-line) after breaking the 0.382 Fibonacci retracement level. Following the sell signal we gave last week, with the 4H MA50 (red trend-line) as Resistance/ entry point, we are starting to turn bullish on Gold after a long time. The 1D RSI is very close to
-
EURUSD Approaching the ultimate Support Cluster. Long-term buy.
- February 24, 2023
- Posted by: Tradingshot Articles
- Category: Forex
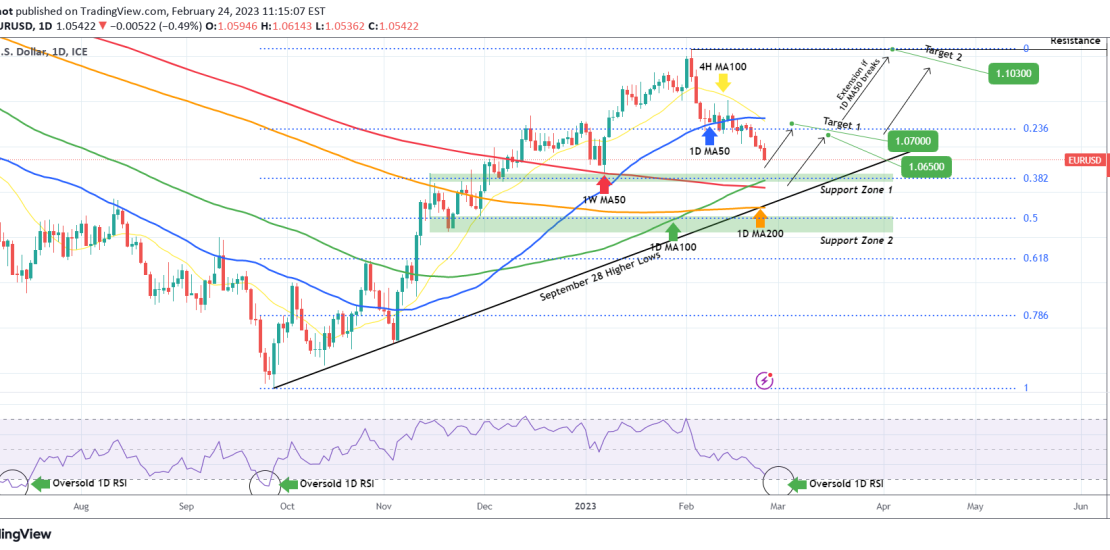
The EURUSD pair gave us the decline we wanted as described on our last analysis 10 days ago: The price is now approaching Support Zone (1.04800 – 1.04500), which is also around the 0.382 Fibonacci retracement level. The Support Cluster is getting extremely strong considering that the 1W MA50 (red trend-line) is right below, which
-
BITCOIN Radical Grid Fibonacci analysis you’ve never seen before
- February 24, 2023
- Posted by: Tradingshot Articles
- Category: Cryptocurrency
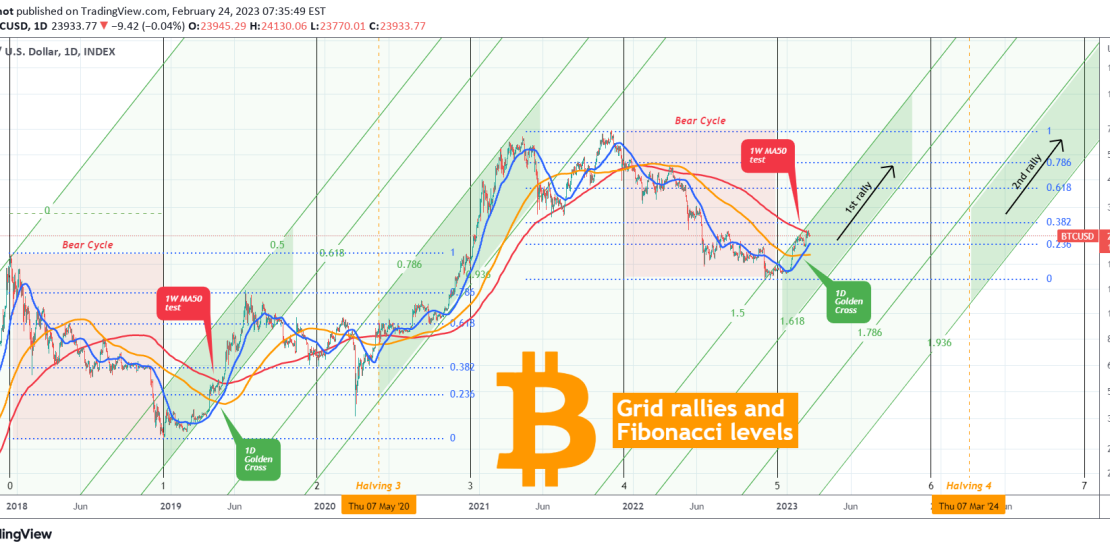
As Bitcoin (BTCUSD) has taken a short-term paus on its early 2023 rally on the 1W MA50 (red trend-line), following the first Golden Cross on the 1D time-frame since May 2020, we naturally go back to the start of the previous Bull Cycle in 2019 to see how it behaved on this important stress test.
-
EURJPY Strong buy signal within a 1 year Channel Up
- February 16, 2023
- Posted by: Tradingshot Articles
- Category: Forex
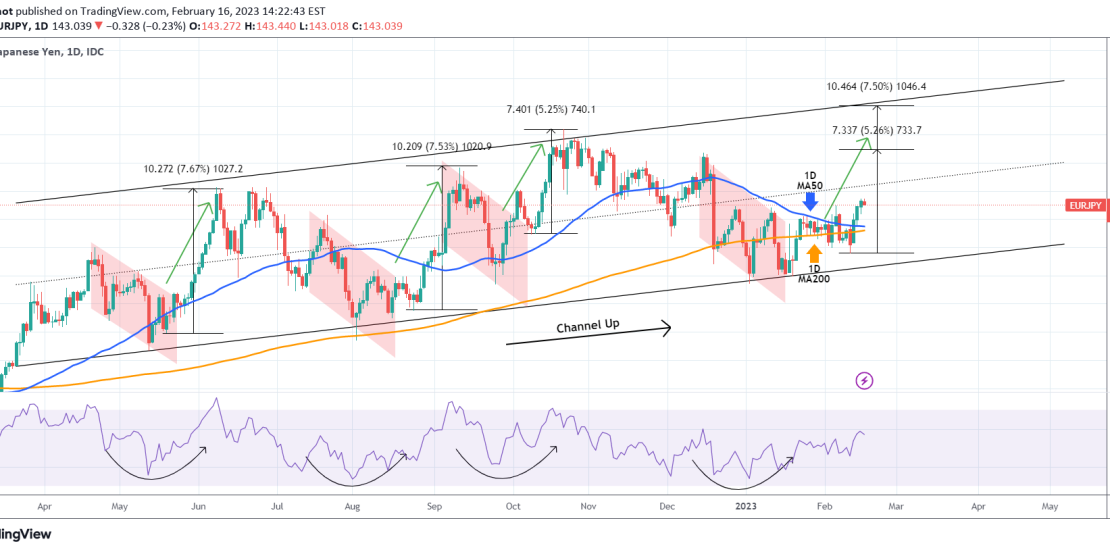
The EURJPY pair is on a three day bullish streak above both the 1D MA50 (blue trend-line) and 1D MA200 (orange trend-line). The pattern for almost a year is a Channel Up, which has a very clear recurring bullish formation. After every 1-month (approximately) Channel Down (red pattern) and a U-shaped reversal on the 1D
-
ETHEREUM This is how it reaches $10000
- February 16, 2023
- Posted by: Tradingshot Articles
- Category: Cryptocurrency
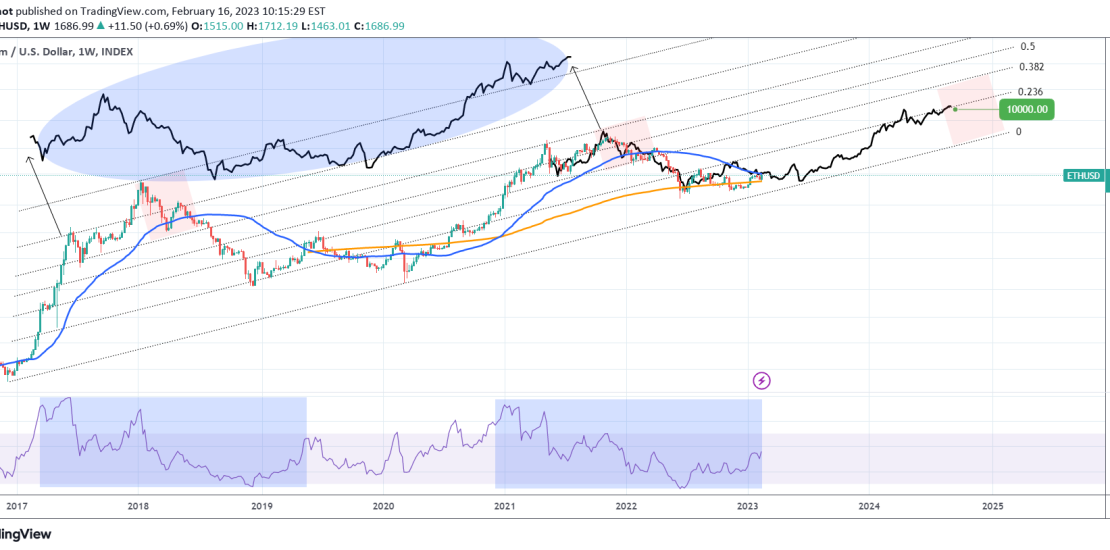
Ethereum (ETHUSD) is also testing its 1W MA50 (blue trend-line), after being supported by the 1W MA200 (orange trend-line) since the start of the year. The 1W RSI sequences of the Bear Cycle that just ended and the previous one in 2018 are identical. By applying the Fibonacci Channel we can clearly see the pressure
-
BITCOIN Amazing Channel and Time Fibonacci reveals the next Top!
- February 16, 2023
- Posted by: Tradingshot Articles
- Category: Cryptocurrency
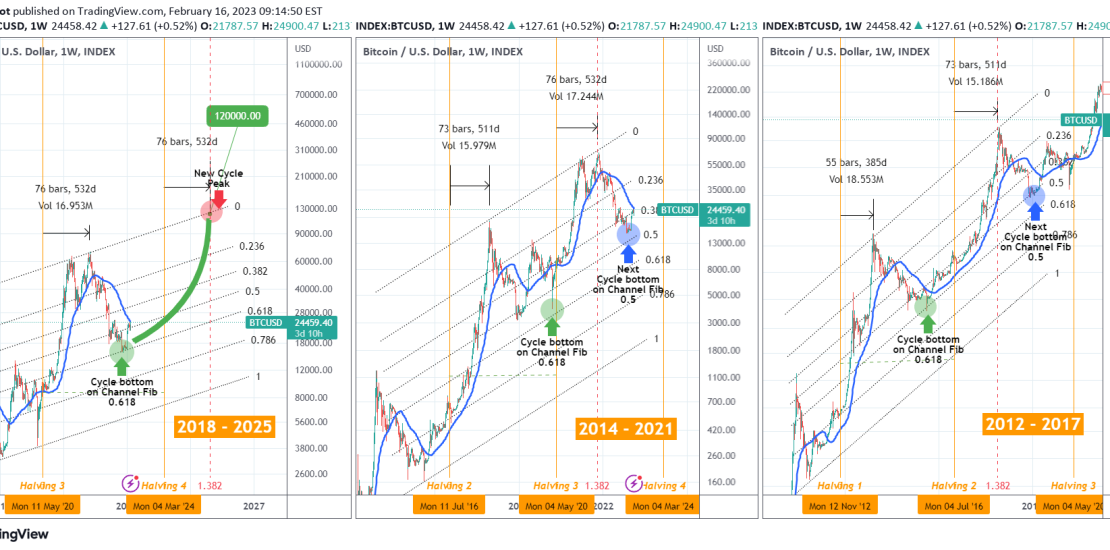
Bitcoin (BTCUSD) is again attracting a lot of interest as it recovered the recent pull-back and even made a new weekly high. Those who follow us over the years know that through fractal and Cycle comparisons we have managed to identify key runs before they happen. ** Hitting the 1W 50 for the first time
-
BITCOIN The Gaussian Channel, last barrier before the new rally
- February 15, 2023
- Posted by: Tradingshot Articles
- Category: Cryptocurrency
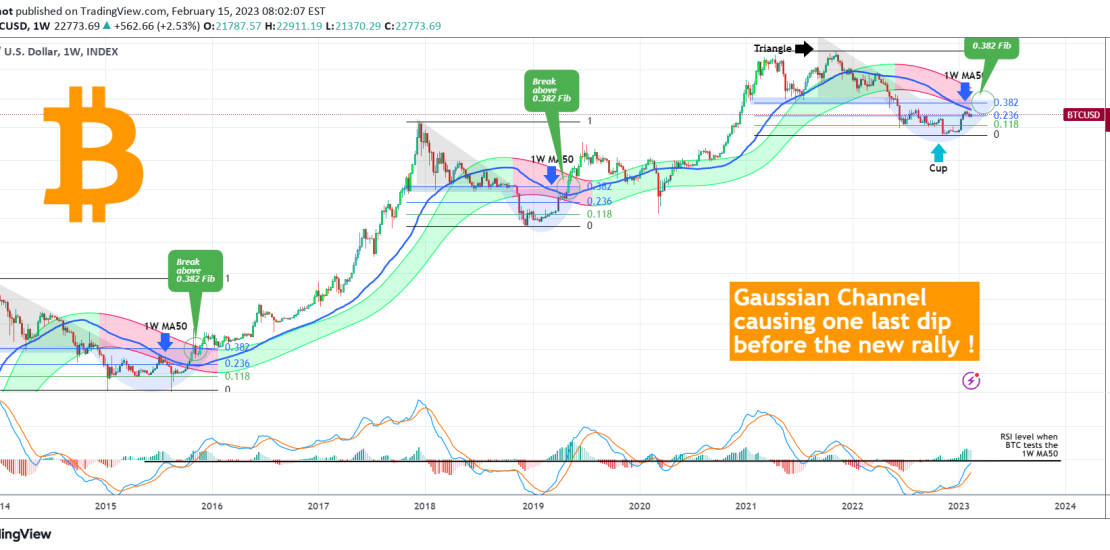
Bitcoin (BTCUSD) has been pulling back since the start of the month as it came close to the 1W MA50 (blue trend-line) but as it failed to break it, it got rejected. This is putting a pause to the January rally and on the 1W time-frame a very interesting pattern is emerging. Based on the
-
NASDAQ Potential short-term correction. The Double Bottom’s test
- February 14, 2023
- Posted by: Tradingshot Articles
- Category: Stock Indices
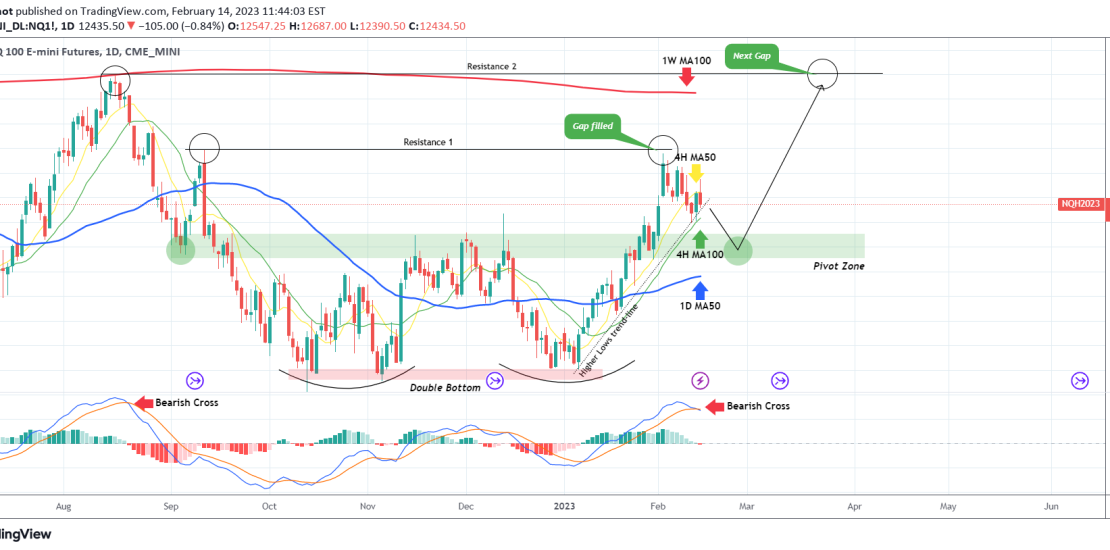
Nasdaq (NDX) broke above its 4H MA50 (yellow trend-line) today but following the U.S. CPI (higher than expected) is giving up the initial gains. We are closing the buy we made last week (as shown below) exactly at the short-term bottom on the Higher Lows trend-line in order to secure the short-term profit: A closing