

- February 15, 2023
- Posted by: Tradingshot Articles
- Category: Cryptocurrency
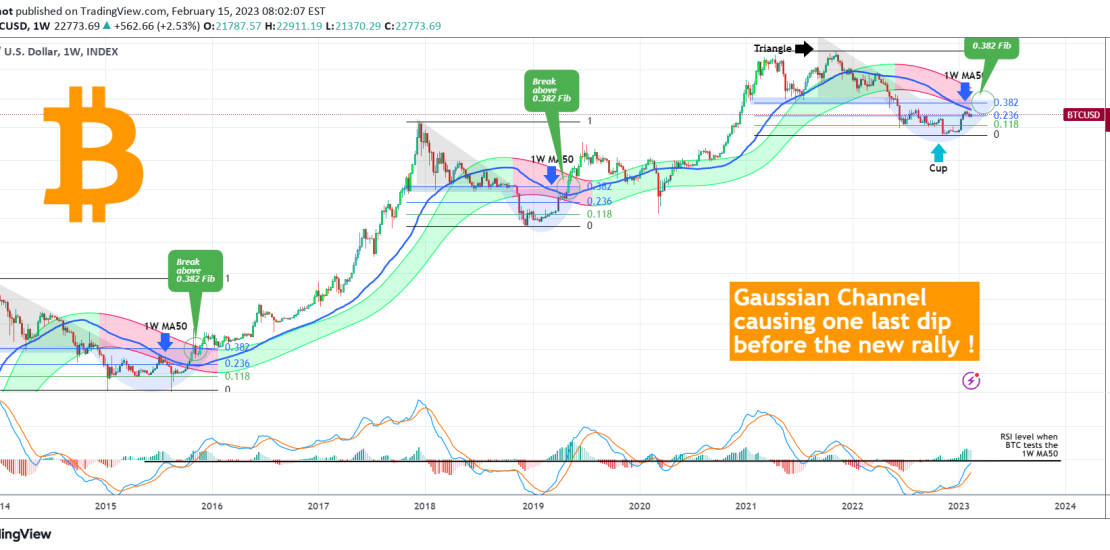
Bitcoin (BTCUSD) has been pulling back since the start of the month as it came close to the 1W MA50 (blue trend-line) but as it failed to break it, it got rejected. This is putting a pause to the January rally and on the 1W time-frame a very interesting pattern is emerging.
Based on the Gaussian Channel, this is a recurring pattern, a formation which combined with the Fibonacci retracement levels, has been seen as the start of both previous Bull Cycles (2015 and 2019).
** Triangle into Cup recovery and the importance of the 0.382 Fibonacci **
First of all, as you see, all Bear Cycles have started with a Triangle pattern and after the Support of the first Bear Low broke, they collapsed aggressively. As the Bear Cycle bottomed, the collapse started to reverse within a Cup pattern (U-shaped recovery). A break and 1W candle closing above the 1W MA50, confirmed the extension of the initial bottom rally into the new rally of the Bull Cycle. Notice how the 0.382 Fibonacci level was the ‘Support of the first Bear Low’ we talked above and once it broke caused a strong spike and later served as a Support itself.
** The Gaussian Channel and the LMACD **
This time the Gaussian Channel’s bottom is exactly on the 1W MA50 with the 0.382 Fib not that far above them. As a result a break into the Gaussian Channel this time will result into all major Resistances breaking almost at once. Also it is very interesting to look at the 1W LMACD and how every time BTC tested the 1W MA50, it was on the 0.00 level. Every time it closed above the 1W MA50, the LMACD broke above the 0.00 as well.
** Where to buy now? **
It is worth noting that after the July 2015 1W MA50 rejection, the price fully filled the gap of the January 2015 Bear Bottom. But that was entirely due to the Bitfinex hack on August 17 2015. Had it not been for this, the pull-back would have been contained on the 0.236 Fib or at the very worst, the 0.118 Fib (green level). In April 2019 for example, during that 1W MA50 rejection, the price was supported by the 0.236 Fib. For comparison purposes, the current 0.118 Fib is at $18800. See the chart below, we have made the comparison of the FTX and Bitfinex crashes back in November 14 when the market was at its highest Fear level and nobody expected a rebound. So far it has been playing out very accurately:

It is easy to understand that we are near a critical Resistance cluster, which if broken will start the next rally phase and Bitcoin won’t look back.
Are you waiting for max pain at $18.8k to get in or you have bought already? Feel free to let us know in the comments section below!
Tradingview link: