

- February 16, 2023
- Posted by: Tradingshot Articles
- Category: Cryptocurrency
Bitcoin (BTCUSD) is again attracting a lot of interest as it recovered the recent pull-back and even made a new weekly high. Those who follow us over the years know that through fractal and Cycle comparisons we have managed to identify key runs before they happen.
** Hitting the 1W 50 for the first time in 11 months **
Now, as BTC just hit its 1W MA50 (blue trend-line) and is attempting a closing above it for the first time since late March 2022, the new Bull Cycle is starting on a V-shaped recovery. Using the Fibonacci Channel levels and the Fibonacci Time extensions, we have identified a unique Cycle combination that can show where this Cycle’s Top could be and it has never failed in Bitcoin’s history.
** Fibonacci Channel **
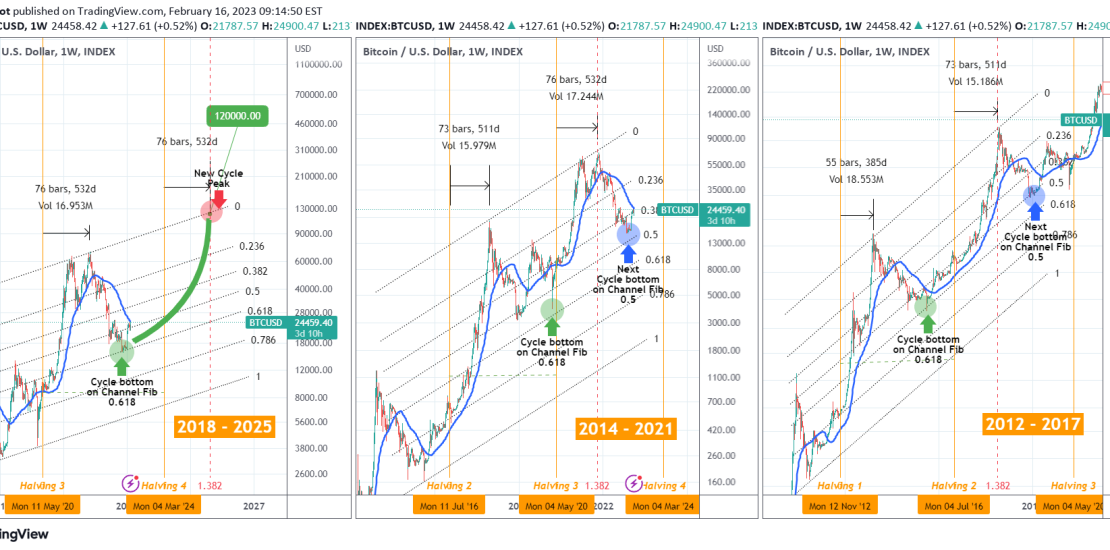
By applying the Fibonacci Channel from the bottom of the 2011 (November) Bear Cycle to the tops of the 2013 (December) and 2017 (December) Bull Cycles, we see that the bottom of the 2014 Bear Cycle was on the 0.618 Fibonacci (green circle). The bottom of the next 2018 Bear Cycle was on the 0.5 Fibonacci (blue circle).
We get the exact same results if we apply the Fibonacci Channel on the bottom of the 2015 (August) Bear Cycle to the tops of the 2017 (December) and 2021 (November) Bull Cycles. 2020 bottom near the 0.618 Fibonacci (green circle) and bottom of the next 2022 Bear Cycle near the 0.5 Fibonacci (blue circle).
** The Time Fibonacci extensions and Halvings **
If we apply the Time Fibonacci approach on the first two Halvings (1 & 2) we wee that the December Top of the 2017 Bull Cycle was on the 1.382 Fibonacci extension. We get the exact same result if we apply this metric on Halvings 2 & 3. The November 2021 Bull Cycle Top was on the 1.382 Fibonacci extension. Both Tops formed within 510 – 530 days from their last Halving.
** Where can the new Top be? **
If we apply the same methodology on the February 2019 bottom and November 2021 top, we see that consistent with the previous Fibonacci Cycles, the November 2021 bottom took place on the 0.618 Fibonacci Channel retracement level. If the pattern is completed the same way as the previous two, then the Top of the Bull Cycle that has just started should be at the top of the Channel (Fib 0.0) around the 1.382 Time Fibonacci extension from the Halvings. This gives a rough estimate of $120000 byAugust 2025!
Do you agree with the results that this approach that has never failed in history, gives? If not what is your expected top for this Cycle? Feel free to let us know in the comments section below!
Tradingview link: