

- February 16, 2023
- Posted by: Tradingshot Articles
- Category: Cryptocurrency
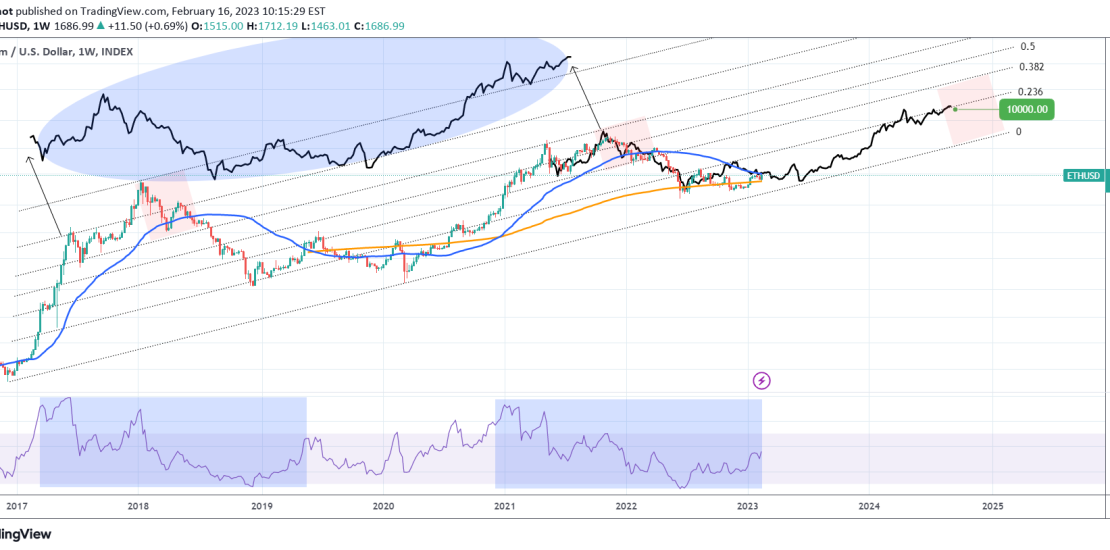
Ethereum (ETHUSD) is also testing its 1W MA50 (blue trend-line), after being supported by the 1W MA200 (orange trend-line) since the start of the year. The 1W RSI sequences of the Bear Cycle that just ended and the previous one in 2018 are identical.
By applying the Fibonacci Channel we can clearly see the pressure points as Resistance and Support levels during both the downtrends and uptrends. The top of the recent Cycle was on the 0.618 Fibonacci retracement level, two Fibs lower than the January 2018. The next one could be on the 0.382 Fib (two Fibs Lows than November 2021).
If we apply the 2018 – 2021 price action on the current Cycle, we see that it is a near perfect match and it very well respects the boundaries of the Fibonacci Channel. However it tops on the 0.236 Fibonacci and that gives a projection marginally above $10000.
Do you think that will be this Cycle’s Top?
Tradingview link:
https://www.tradingview.com/chart/ETHUSD/V2xmh4LU-ETHEREUM-This-is-how-it-reaches-10000