

- February 24, 2023
- Posted by: Tradingshot Articles
- Category: Cryptocurrency
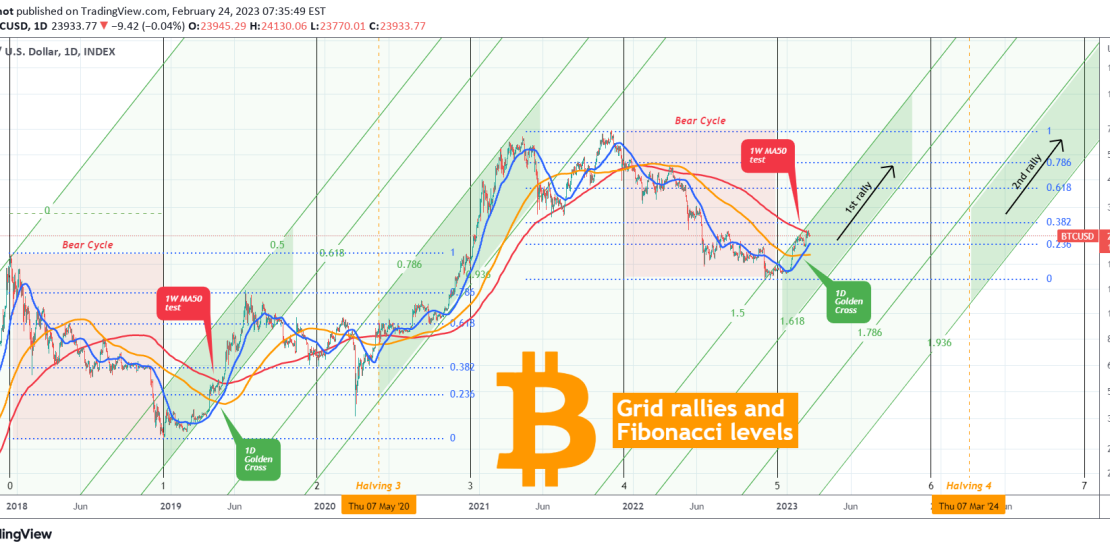
As Bitcoin (BTCUSD) has taken a short-term paus on its early 2023 rally on the 1W MA50 (red trend-line), following the first Golden Cross on the 1D time-frame since May 2020, we naturally go back to the start of the previous Bull Cycle in 2019 to see how it behaved on this important stress test.
** The 2019 Bull Cycle **
As you see, BTC also took a sideways pause on its 1W MA50 in April 2019, also after a 1D Golden Cross, while being above the 0.236 Fibonacci retracement level (blue dotted trend-lines) of its Cycle High. So far the current Cycle with 2019 are identical.
** The Channel Fibonacci levels **
We decided to take this symmetry a step forward in order to get a better understanding of how the new Cycle may play out. We have applied the Fibonacci Channel (green trend-line) starting of course from the December 2017 High. As you see, the Cycle’s 1st rally, which is what we are experiencing now, firmly traded within the 0.5 – 0.618 Channel Fibonacci levels (green) before getting rejected on the 0.786 horizontal Fib (blue). The Cycle’s 2nd rally, which was the final and most aggressive part of the Bull Cycle, was within the 0.786 – 0.936 Channel Fibs (green).
** The Time Fibonacci levels **
Besides the Channel and horizontal Fibs, we have incorporated the Time Fibs (black vertical lines). Starting from the top of the previous Bear Cycle (December 2017) and ending at its bottom (December 2018), we see that it has more or less classified each part of the Cycle and even caught pretty well the next Bear Cycle, roughly within Time Fib 4.0 – 5.0.
Based on that model, the new Cycle’s 1st rally should be within Time Fib 5.0 – 6.0 and the 2nd rally some time after Time Fib 6.0. It is widely known that the Halving events (supply shock for Bitcoin) is what officially start the final rallies. In 2020 that was in May and the next one (Halving 4) will be in March 2024.
** Conclusion **
Based on the above parameters put together, we are now experiencing Bitcoin’s 1st rally of the new Bull Cycle, within Channel Fibs 1.5 – 1.618. The 2nd rally should start fundamentally after March 2024 (Halving 4), but technically it can do so if the price closes a 1D (or even better 1W) candle above horizontal Fib 0.786. By Time Fib 7.0, the market should have made a new All Time High (i.e. be above $69000) and by Time Fib 8.0 already place the new Cycle Top.
Do you agree with the projections suggested by this Fibonacci Grid Model? Feel free to let us know in the comments section below!
Tradingview link: