

2022
-
NZDJPY Pull-back first, 88.000 – 90.000 later.
- November 10, 2022
- Posted by: Tradingshot Articles
- Category: Forex
No Comments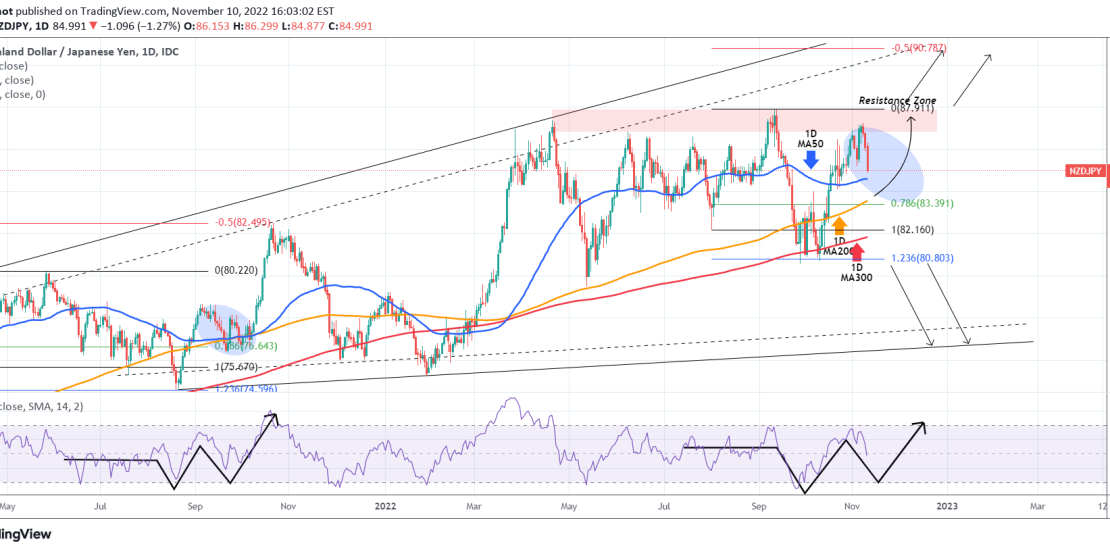
The NZDJPY pair followed very closely the trading plan we presented on our last September 22 analysis: As you see after a drop to the 1.236 Fibonacci extension, the price rebounded aggressively back to the Resistance Zone. What helped us make this accurate projection were the striking similarities that presented early on with the
-
META Can cutting 11000 jobs reverse the bearish outlook alone?
- November 10, 2022
- Posted by: Tradingshot Articles
- Category: Stocks
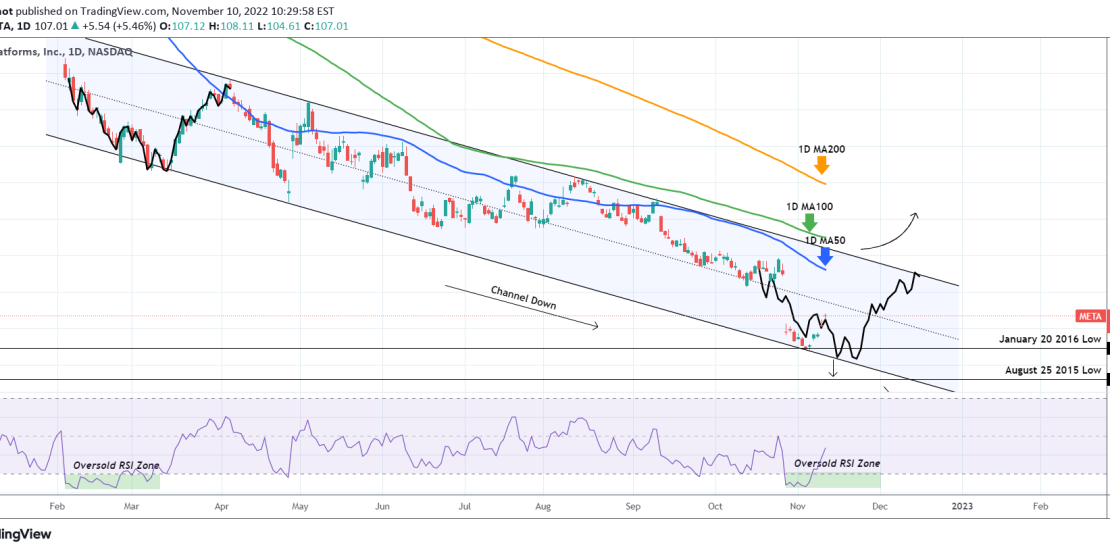
The news of a 11k jobs cut had an immediate bullish impact on the Meta Platforms Inc (META) stock, helping it break above the 100.00 barrier again. Today’s much lower than expected CPI number is also adding fuel on this rally but can those alone push the price out of the death spiral it
-
BITCOIN Inflation down -0.5% a 9-month low! Is it truly Bullish?
- November 10, 2022
- Posted by: Tradingshot Articles
- Category: Cryptocurrency
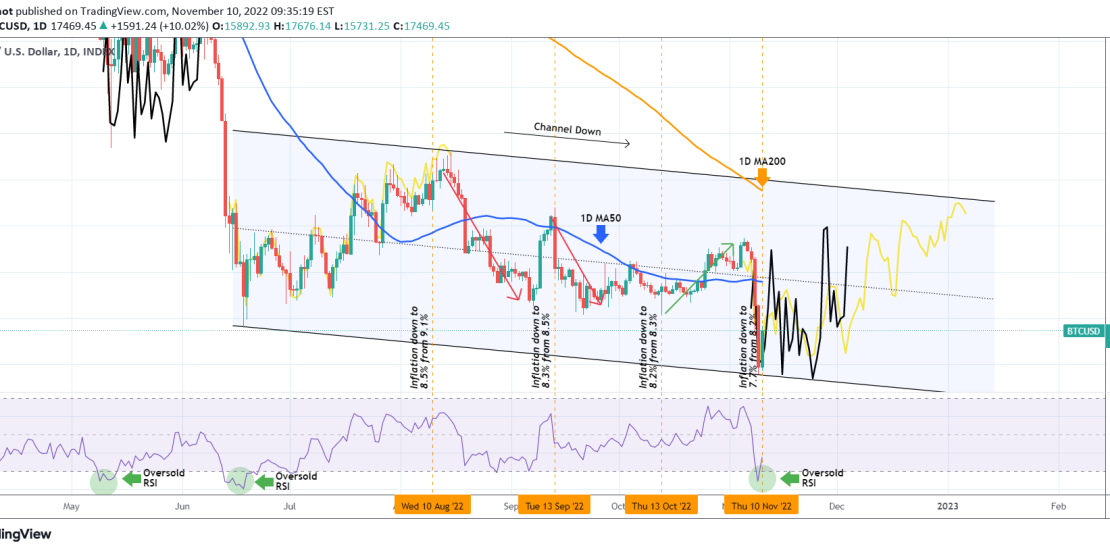
Bitcoin (BTCUSD) is having an initial bullish reaction before the U.S. session opens following a more than expected -0.5% drop on the U.S. CPI to 7.7% from 8.2% in the previous month. This reading beat the forecast by 0.3%. Is a drop to inflation truly bullish for BTC? To answer this, we should look
-
AUDCAD Rebounding with the 1D MA50 being the key to a break-out.
- November 8, 2022
- Posted by: Tradingshot Articles
- Category: Forex
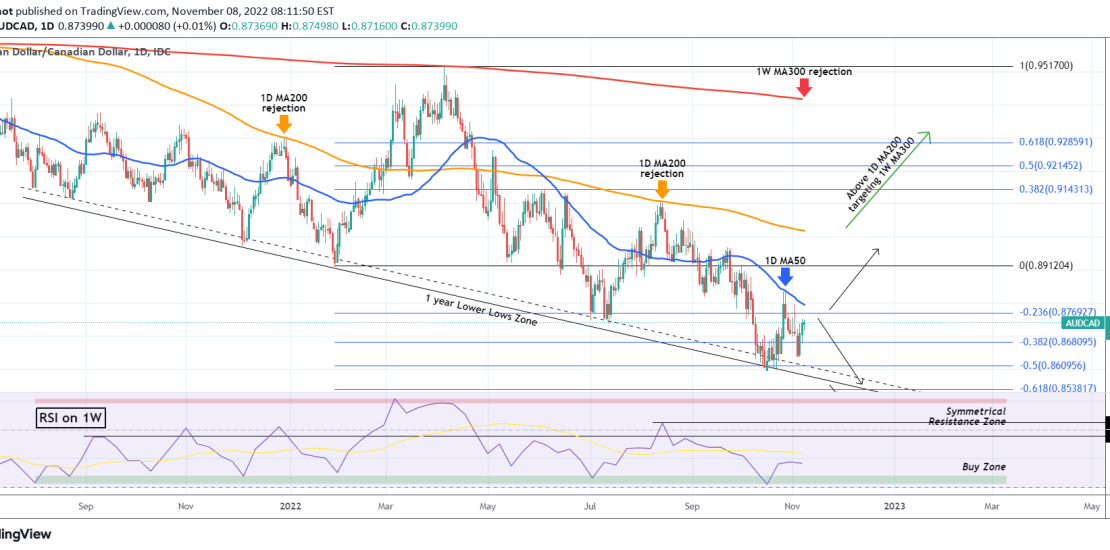
The AUDCAD pair has on a 2 day rebound after the pull-back on the 1D MA50 (blue trend-line) rejection on October 27. This couldn’t have validated better our previous analysis on September 20: As you see, the 1 year Lower Lows Zone is holding and as long as it does, the price should push
-
EURCAD Neutral for now. Resistance and Support for the long-term
- November 8, 2022
- Posted by: Tradingshot Articles
- Category: Forex
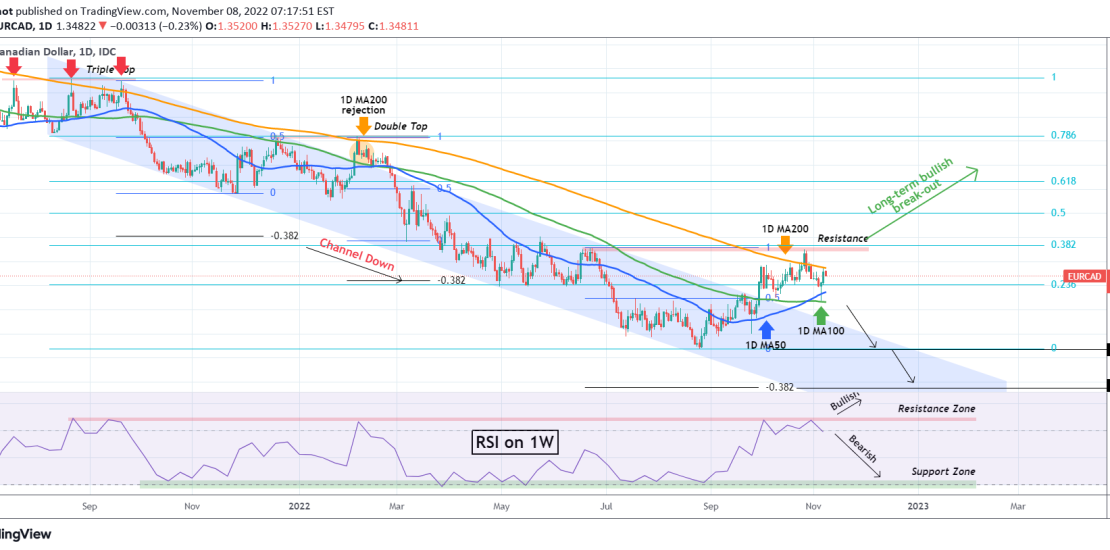
The EURCAD pair couldn’t have traded better our September 19 set-up as the price broke above the 1 year Channel Down and broke above the 1D MA200 (orange trend-line) for the first time since Feb 07 2022, but got rejected on the 1.37150 Resistance: This Resistance rejection pattern has taken place another two times
-
GOOGLE A very bullish 2023 and this chart shows why.
- November 7, 2022
- Posted by: Tradingshot Articles
- Category: Stocks
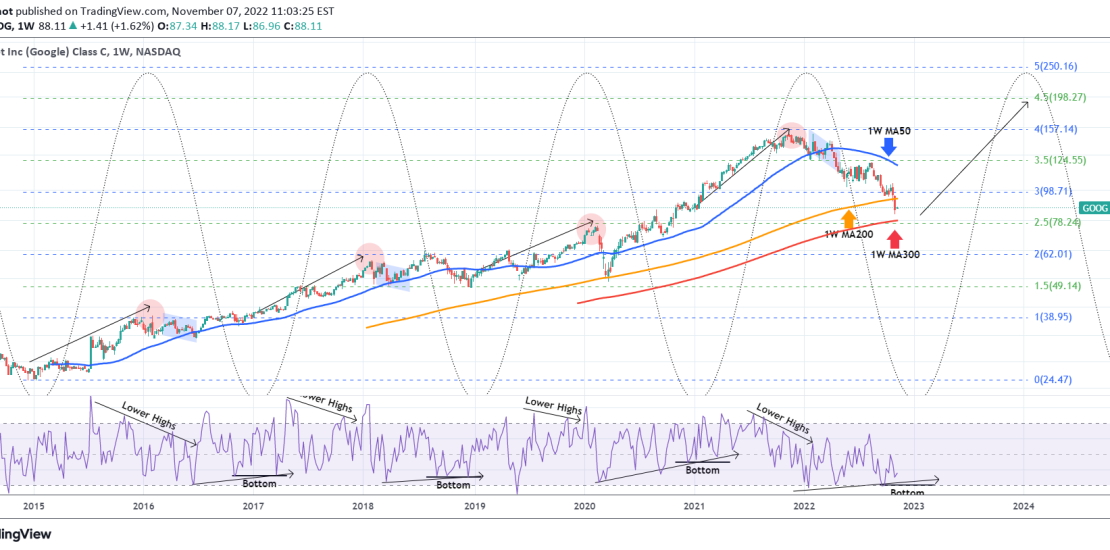
Alphabet Inc. (GOOG) broke two weeks ago below its 1W MA200 (orange trend-line) for the first time since the March 2020 COVID crash. The next Support level is the 1W MA300 (red trend-line). Since its IPO, the stock has had very symmetric Cycles which with the help of the Sine Waves can show tops
-
CHFJPY Undecided around the 1D MA50.
- November 7, 2022
- Posted by: Tradingshot Articles
- Category: Forex
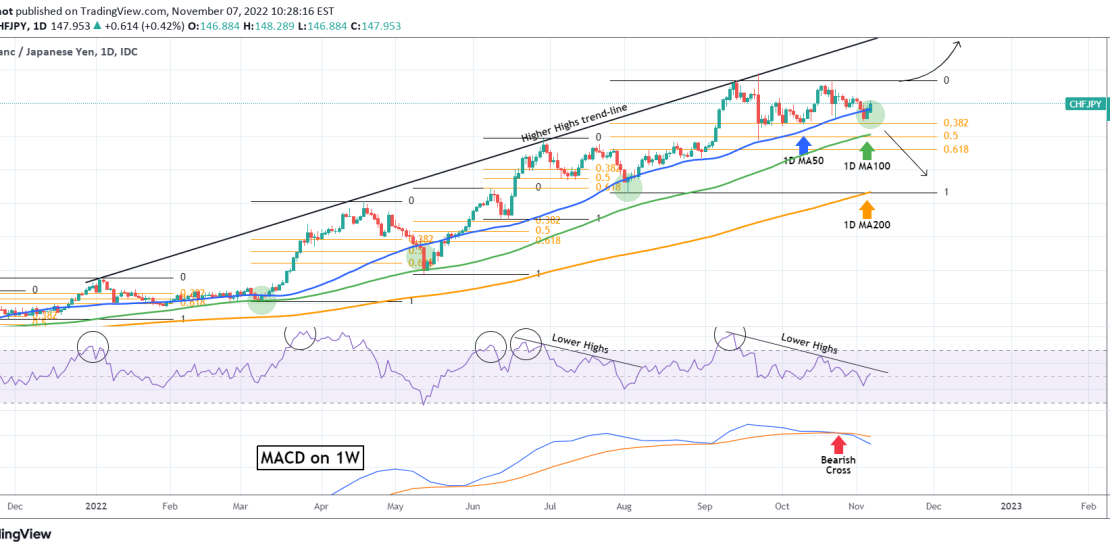
The CHFJPY pair has been trading on one of the most consistent patterns of the last 12 months as we accurately outlined on our last analysis in mid September: Once again the signal played out as it pulled-back as low as the 0.5 Fibonacci retracement level and then the price has been trading sideways
-
AUDJPY The Lower Highs the key to our trades.
- November 7, 2022
- Posted by: Tradingshot Articles
- Category: Forex
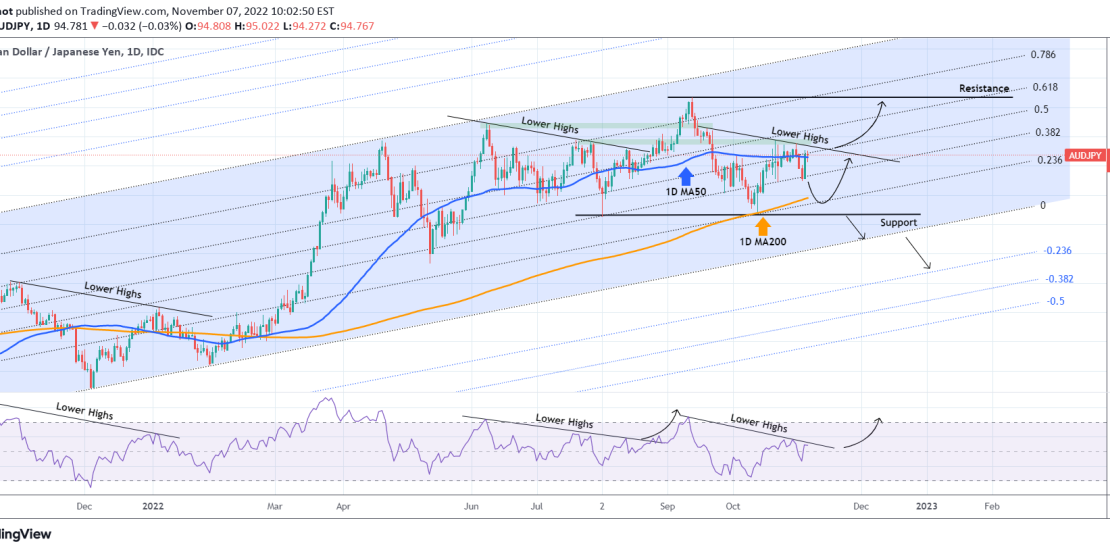
The AUDJPY pair is currently trading on its 1D MA50 (blue trend-line), being the pivot since the price turned sideways during Summer. The long-term trend remains bullish however within a 1 year Channel Up (better viewed with the Fibonacci levels as you see) with the 1D MA200 (orange trend-line) supporting. Recently it has formed
-
XAUUSD Close to a major bullish break-out!
- November 7, 2022
- Posted by: Tradingshot Articles
- Category: Commodities
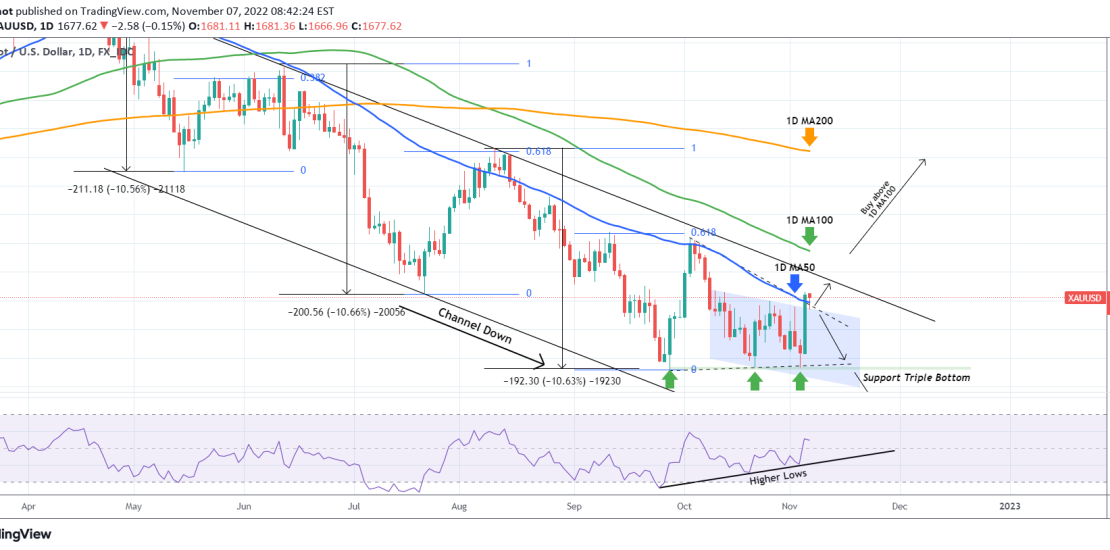
Gold (XAUUSD) closed on Friday above the 1D MA50 (blue trend-line) for the first time since August 12 that was practically the time that the stock market made its previous High. At the same time, Gold broke and closed above both the former Channel Down and Triangle patterns that we discussed where bullish break-out
-
BITCOIN Is LTC a leading indicator to BTC’s Bull Cycle??
- November 4, 2022
- Posted by: Tradingshot Articles
- Category: Cryptocurrency
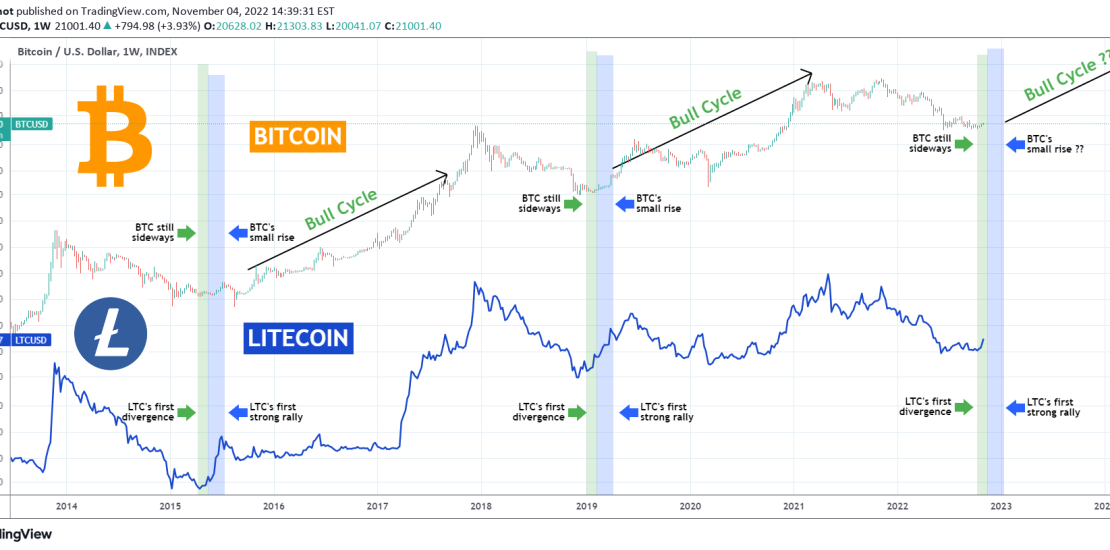
This is a chart on the 1W time-frame of Bitcoin (BTCUSD) and Litecoin (LTCUSD). This is not the first time we do this analysis, those who follow for long will know that during the previous BTC Cycle, right when it was consolidating after the December 2018 bottom, we used LTC’s price action to identify