

- November 8, 2022
- Posted by: Tradingshot Articles
- Category: Forex
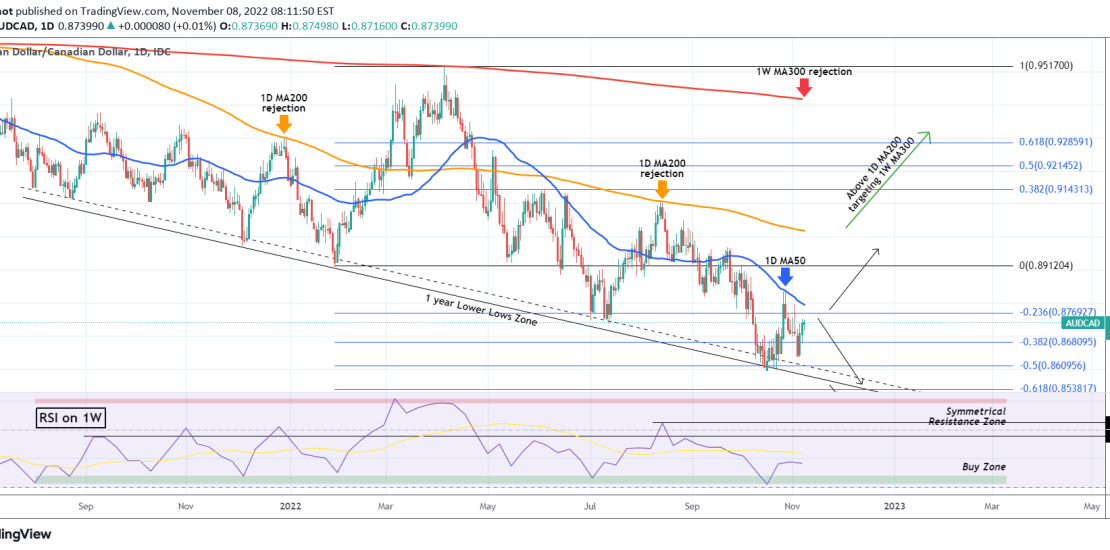
The AUDCAD pair has on a 2 day rebound after the pull-back on the 1D MA50 (blue trend-line) rejection on October 27. This couldn’t have validated better our previous analysis on September 20:

As you see, the 1 year Lower Lows Zone is holding and as long as it does, the price should push for a new Lower High or at least a 1D MA200 (orange trend-line) test. Practically, we can only trade this based on how the 1D MA50 pivots. A 1D closing above the 1D MA50 would be a bullish break-out signal targeting the 1D MA200, while a further closing above it, would target the 1W MA300 (red trend-line) that had its most recent test on April 05.
At the same time, the more the price fails to close above the 1D MA50, the stronger of a Sell Signal it becomes, targeting the 1 year Lower Lows Zone.
Tradingview link: