

- November 10, 2022
- Posted by: Tradingshot Articles
- Category: Forex
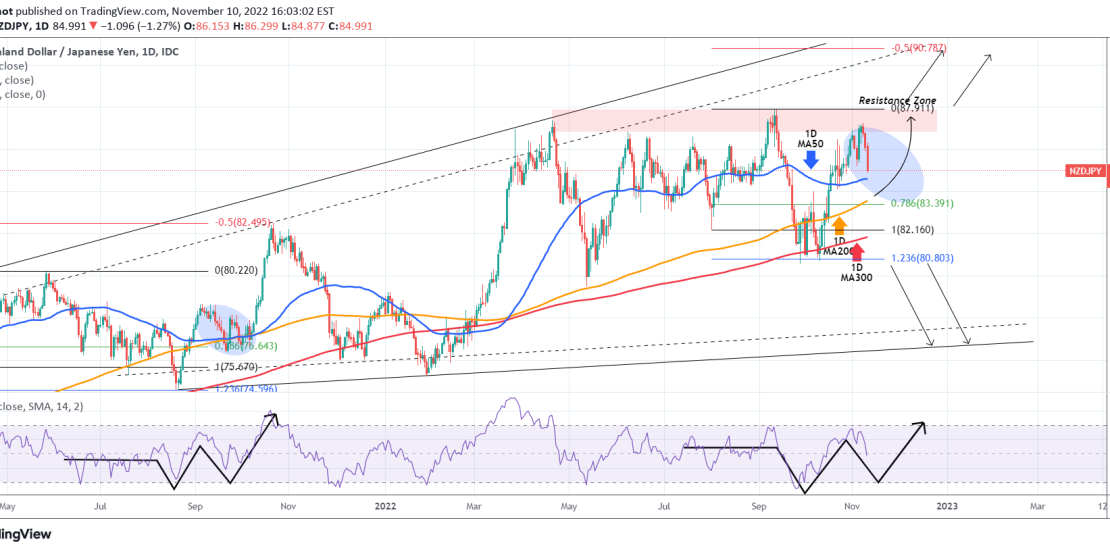
The NZDJPY pair followed very closely the trading plan we presented on our last September 22 analysis:

As you see after a drop to the 1.236 Fibonacci extension, the price rebounded aggressively back to the Resistance Zone. What helped us make this accurate projection were the striking similarities that presented early on with the June – September 2021 fractal. It appears that we are inside the blue oval pull-back which was completed just below the 0.786 Fibonacci level and then bounced for a new High on the -0.5 Fib extension.
See how similar their RSI patterns are as well. As a result, once this pull-back is completed, we expect a rise first to the 87.900 Resistance (top) and the -0.5 Fib above 90.000.
Tradingview link:
https://www.tradingview.com/chart/NZDJPY/Tk3Lf0SE-NZDJPY-Pull-back-first-88-000-90-000-later