

2022
-
TONUSDT Lower Highs break-out but Resistance come to play
- June 28, 2022
- Posted by: Tradingshot Articles
- Category: Cryptocurrency
No Comments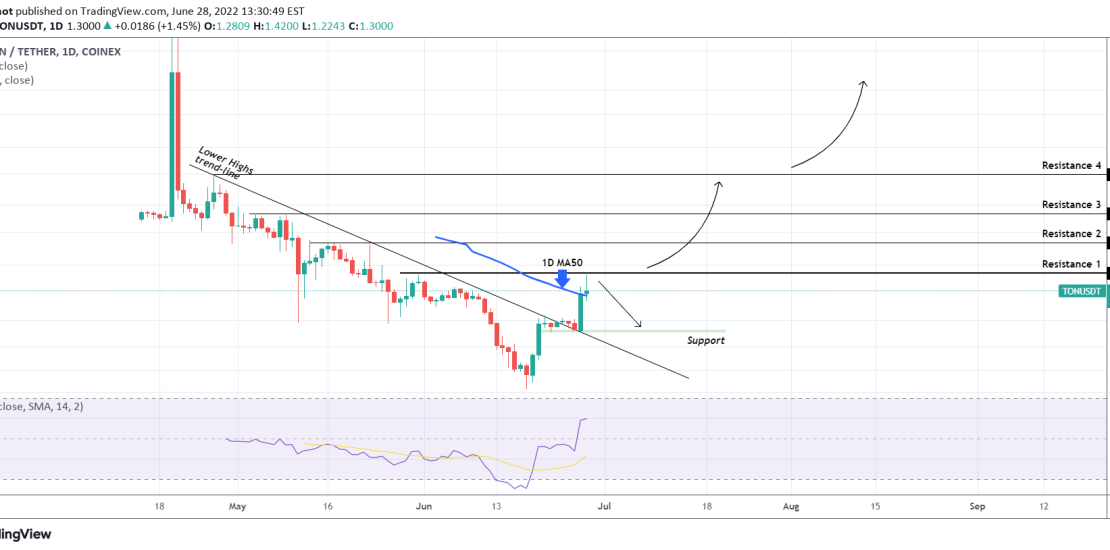
Toncoin (TONUSDT) made a convincing bullish break-out yesterday above the Lower Highs trend-line that has been keeping the price action below since the April 21 dump. Today it is attempting a 1D candle closing above the 1D MA50 (blue trend-line). After the break-out that turned the trend bullish at least on the short-term, the
-
EURUSD Stuck between the 4H MA50 and MA200
- June 28, 2022
- Posted by: Tradingshot Articles
- Category: Forex
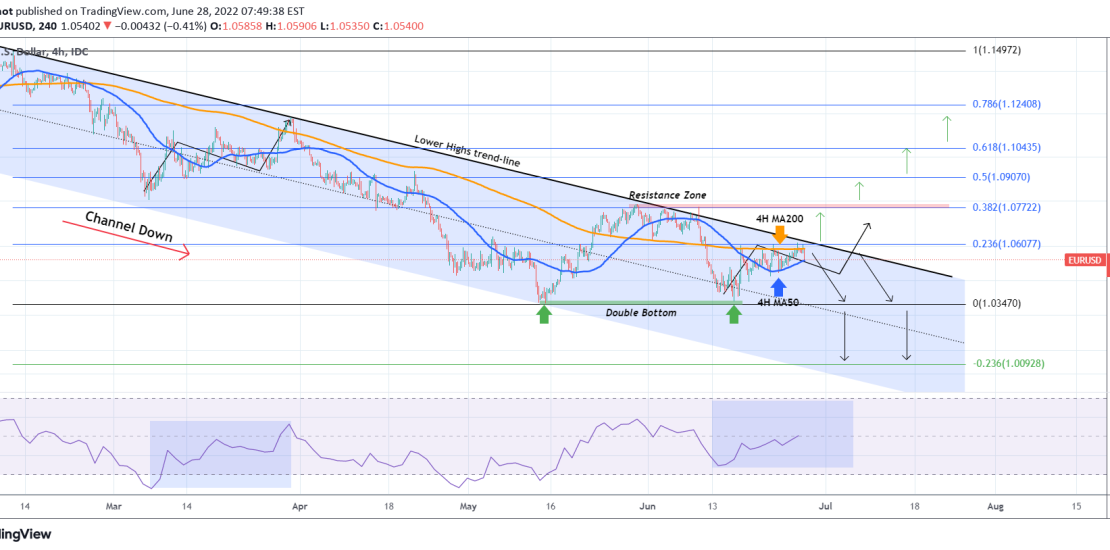
The EURUSD pair has been trading within a Channel Down since the February 10 High but lately in particular since June 20, it has been sideways within the 4H MA50 (blue) and 4H MA200 (orange trend-line). Our last EURUSD idea on the 4H time-frame, accurately caught the most recent top of the Channel all
-
S&P500 1D MA50 ahead. Careful about this Double Bottom scenario.
- June 27, 2022
- Posted by: Tradingshot Articles
- Category: Stock Indices
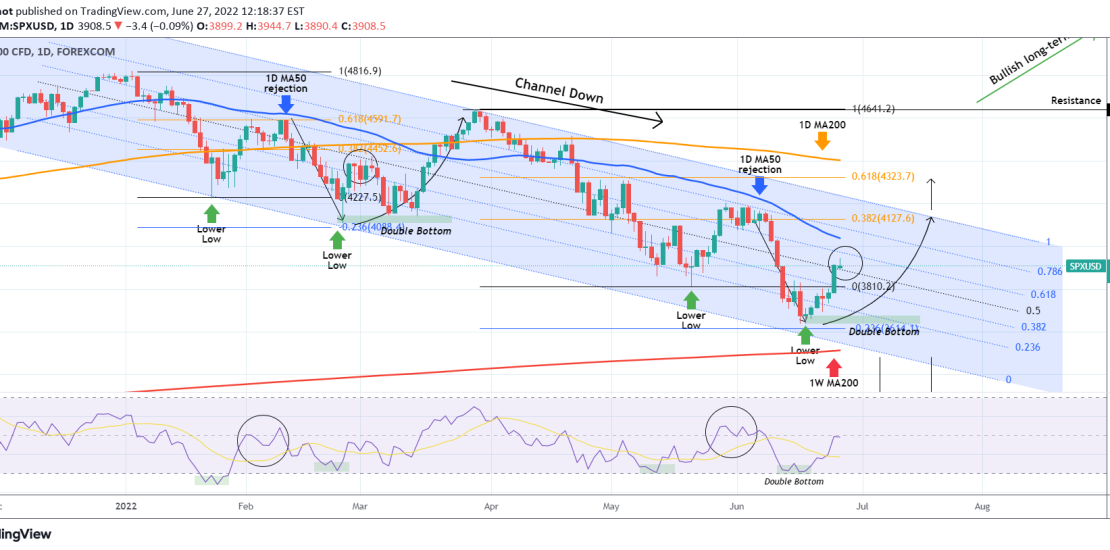
As with the other stock indices, we have certain type of patterns for S&P500 that help us identify medium/ long-term trends and take low risk/ high return positions on the market. In this case, it has been the Channel Down on the 1D time-frame since the January 04 All Time High that has given
-
STORJUSD Amazing rise but needs to break this Resistance
- June 24, 2022
- Posted by: Tradingshot Articles
- Category: Cryptocurrency
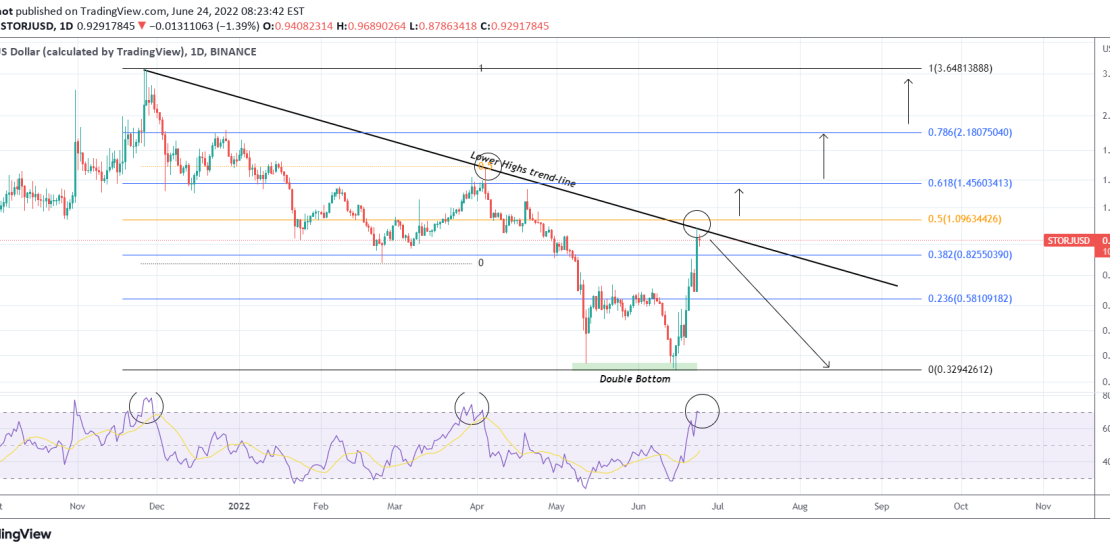
STORJUSD had a very strong rise yesterday, pivoting off the previous 0.62 – 0.64 Resistance level. Despite this heavily bullish short-term trend, the Lower Highs trend-line from its All Time High is now coming to play again and in fact rejected so far the price on its High yesterday. This is the second Lower
-
BITCOIN The Resistance that every Cycle broke to start the rally
- June 24, 2022
- Posted by: Tradingshot Articles
- Category: Cryptocurrency
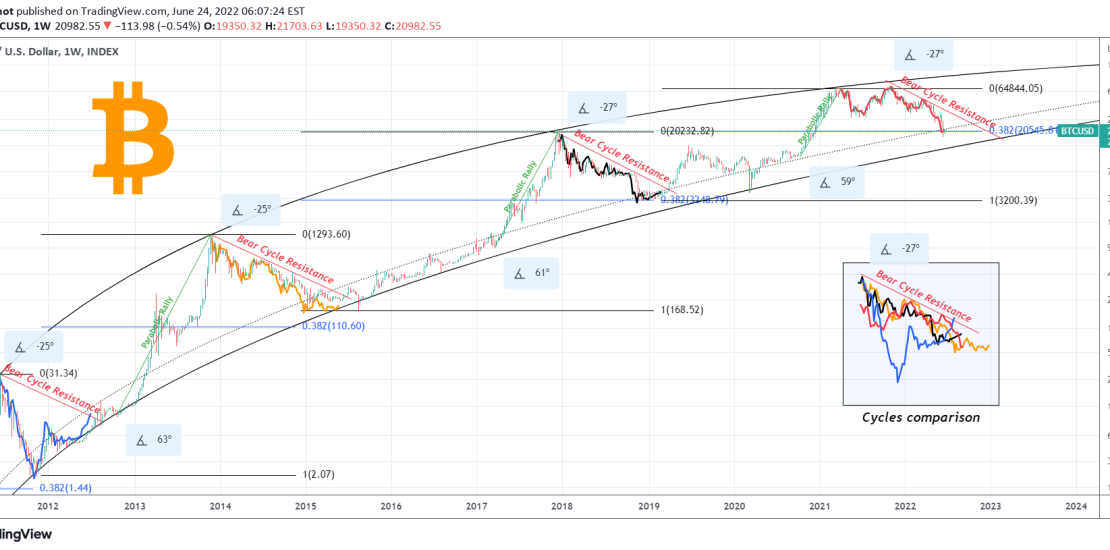
Following the ‘back to basics’ analysis on Bitcoin (BTCUSD) and the reminder that the Parabolic Growth Channel is still dictating its long-term cyclical trend, I thought it would be useful to extend it a bit with new parameters. ** The Parabolic Rally and Bear Cycle Resistance elements ** As you see, I’ve incorporated new
-
PALLADIUM Buy signal to the 1D MA50.
- June 23, 2022
- Posted by: Tradingshot Articles
- Category: Commodities
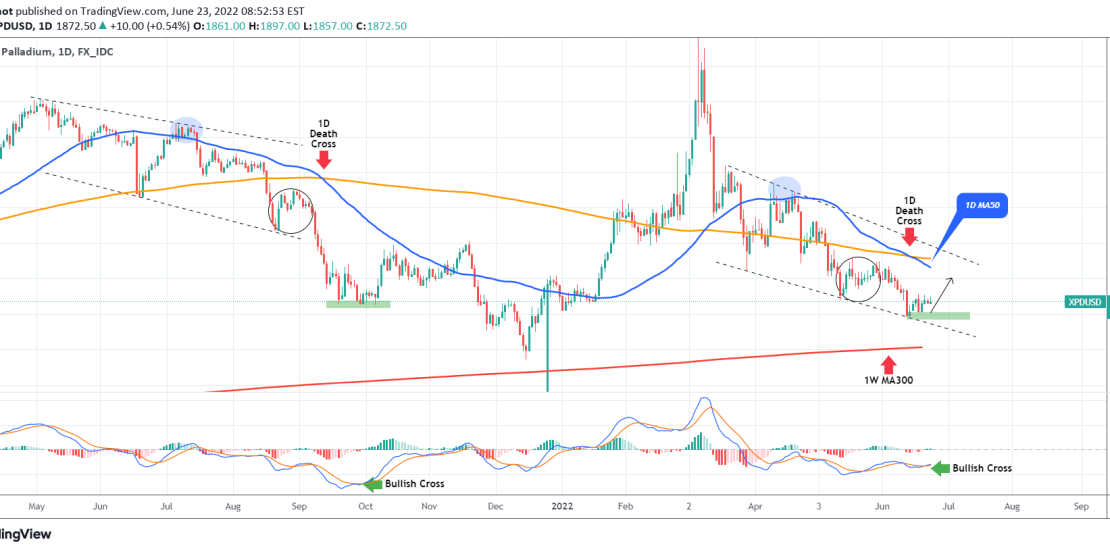
Palladium (XPDUSD) has been trading within a Falling Wedge pattern since late March and below the 1D MA50 (blue trend-line) since April 21. With the 1D Death Cross having been formed (when the 1D MA50 crosses below the 1D MA200), the market seems to be pricing a bottom, rather than preparing for a deeper
-
EURUSD High chances of finally turning bullish
- June 22, 2022
- Posted by: Tradingshot Articles
- Category: Forex
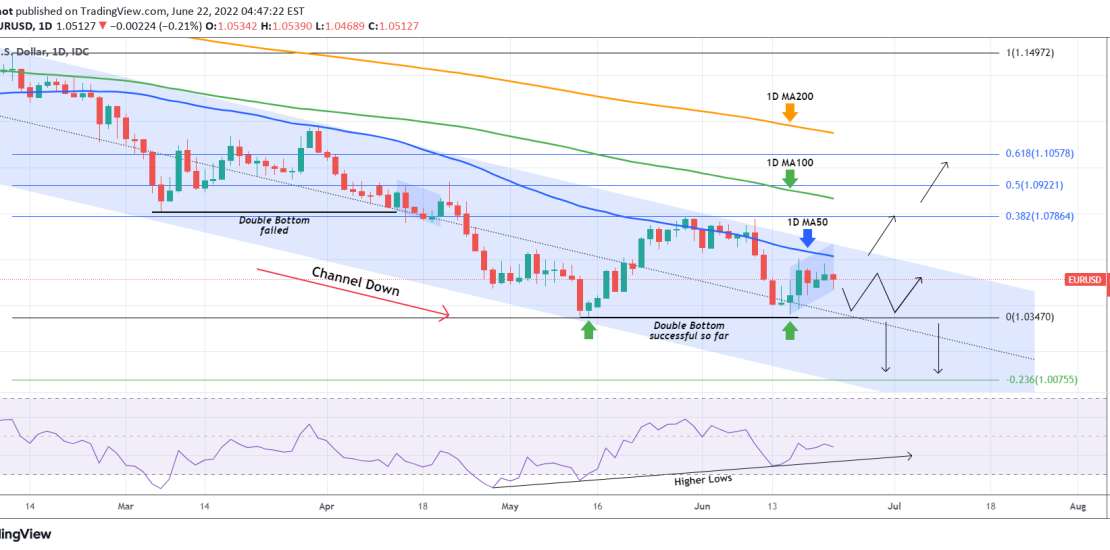
The EURUSD pair has been trading within a Channel Down pattern since the February 10 High. The 1D MA100 (green trend-line) turned into Resistance a day later and the price has been trading below it ever since. The 1D MA50 (blue trend-line) broke only marginally recently but still made a Lower High on the
-
USDRUB made 7 year lows but getting close to long-term buy level
- June 22, 2022
- Posted by: Tradingshot Articles
- Category: Forex
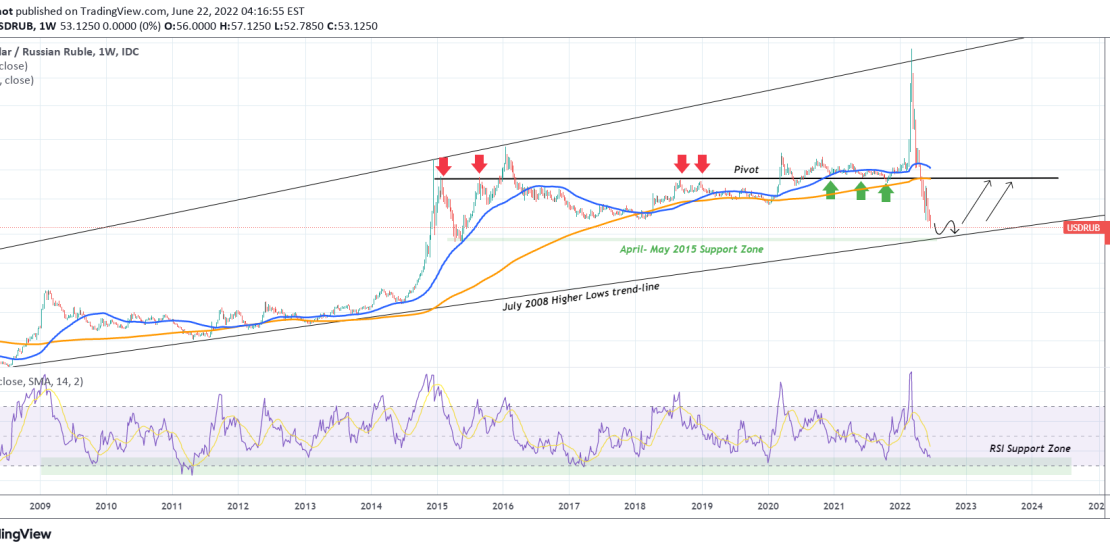
The USDRUB pair hit this week the lowest levels since June 2015, marking a remarkable turnaround for the Ruble (drop on the pair around -65%) since the March 2022 High at the peak of the Russia – Ukraine invasion. With this massive drop, the pair is getting very close to the Higher Lows trend-line
-
NATURAL GAS Strong sell towards at least the 1D MA200
- June 20, 2022
- Posted by: Tradingshot Articles
- Category: Commodities
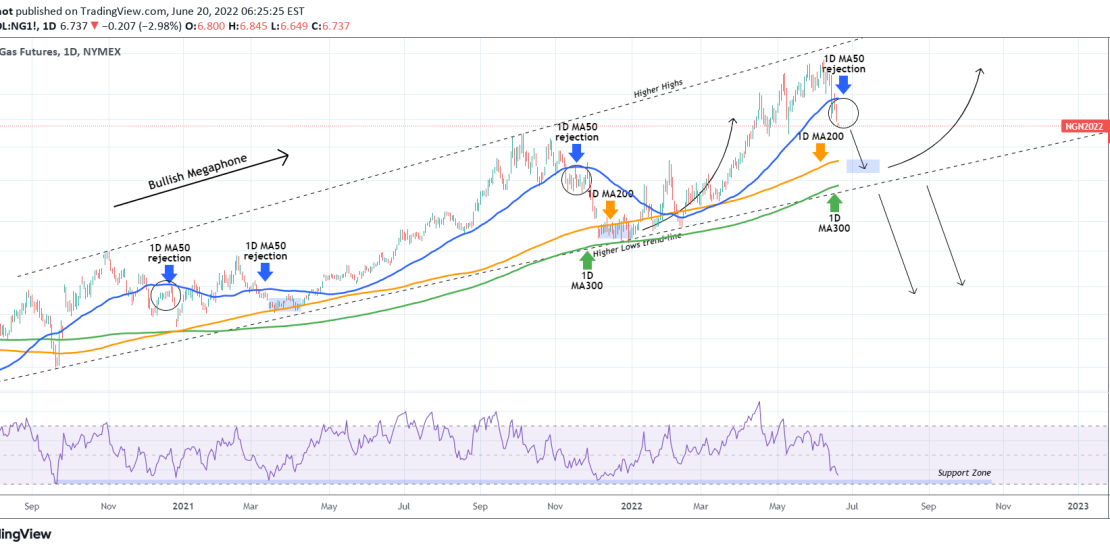
Natural Gas (NG1!) broke below its 1D MA50 (blue trend-line) last week for the first time since February 11 and upon the first re-test as a Resistance, it got rejected. This indicates strong sell bias on the medium-term. The likely target is the zone within the 1D MA200 (orange trend-line) and the 1D MA300
-
NZDCHF Bullish above 0.6400 but act quickly if Support breaks
- June 20, 2022
- Posted by: Tradingshot Articles
- Category: Forex
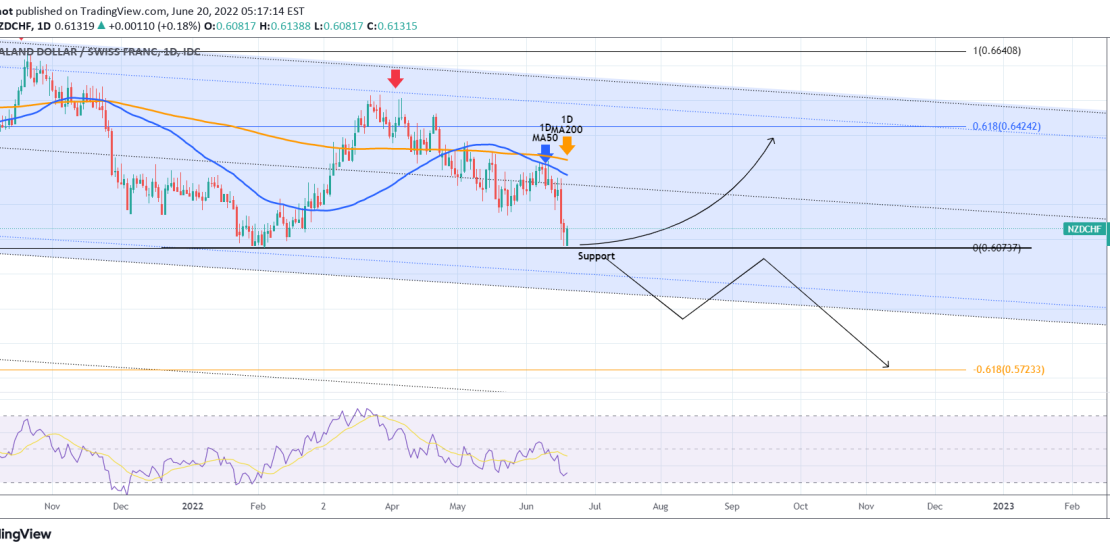
The NZDCHF pair has hit our first macro target as illustrated on the long-term (1W time-frame) analysis posted in May: Now that the Support has been tested, we see (current chart on the 1D time-frame) a bullish reaction as the price is rebounding today. As long as the correlation with the 2017 fractal continue