

- June 28, 2022
- Posted by: Tradingshot Articles
- Category: Forex
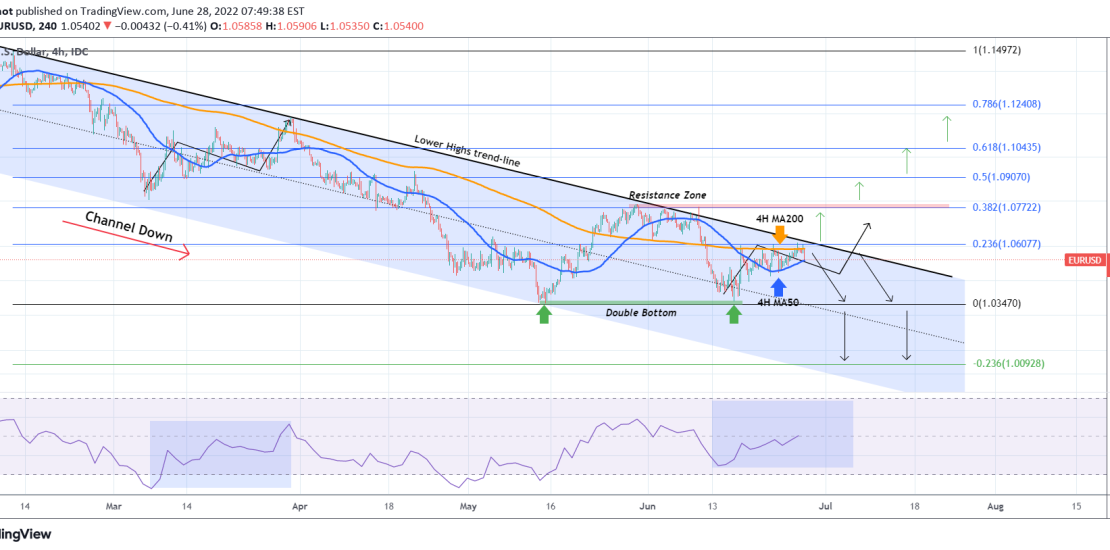
The EURUSD pair has been trading within a Channel Down since the February 10 High but lately in particular since June 20, it has been sideways within the 4H MA50 (blue) and 4H MA200 (orange trend-line).
Our last EURUSD idea on the 4H time-frame, accurately caught the most recent top of the Channel all the way to the Support:

Having a clear Support at 1.03470 on a technical Double Bottom formation, there are high chance of finally breaking above the Lower Highs trend-line of the Channel Down, if the current price action continues to recreate the March 07 – 30 fractal. If not, a rejection on the Lower Highs trend-line, can take the price back to the Support where a 1D candle close below it, opens the way medium-term for prices near 1.0100 (-0.236 Fibonacci extension).
On the other hand, a break above the 1.078555 – 1.07720 Resistance Zone, can be enough to reverse the long-term trend to bullish and start targeting the higher Fibonacci retracement levels.
Tradingview link:
https://www.tradingview.com/chart/EURUSD/Vvhn9CKg-EURUSD-Stuck-between-the-4H-MA50-and-MA200