

- June 20, 2022
- Posted by: Tradingshot Articles
- Category: Forex
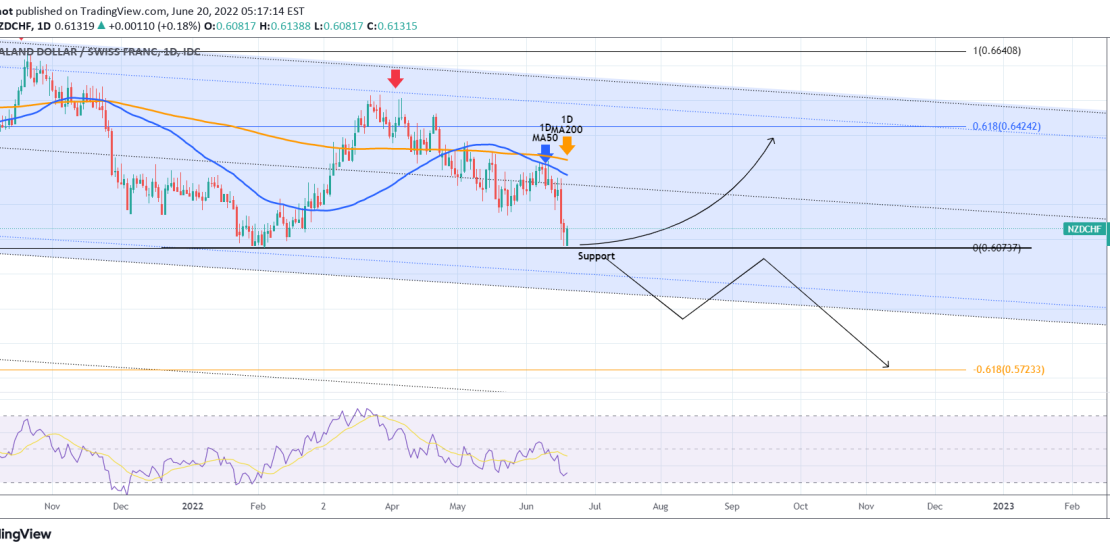
The NZDCHF pair has hit our first macro target as illustrated on the long-term (1W time-frame) analysis posted in May:

Now that the Support has been tested, we see (current chart on the 1D time-frame) a bullish reaction as the price is rebounding today. As long as the correlation with the 2017 fractal continue to hold, we should see a prolonged rebound towards at least the 0.618 Fibonacci retracement level (which is now a little over 0.64000). The 1D RSI is approaching the 30.00 oversold barrier, further enhancing that perspective.
On the other hand, be quick to cut losses and open a counter sell if a candle closes below the 0.60700 Support, as that would most likely be the start of a long-term selling sequence towards the -0.618 Fibonacci extension (a little over 0.57000).
Tradingview link: