

- June 22, 2022
- Posted by: Tradingshot Articles
- Category: Forex
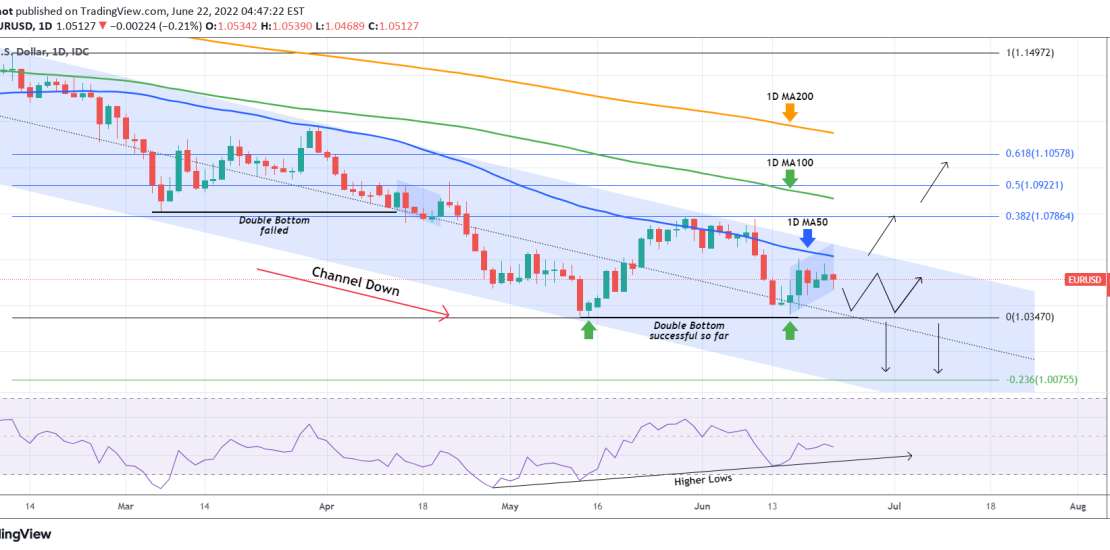
The EURUSD pair has been trading within a Channel Down pattern since the February 10 High. The 1D MA100 (green trend-line) turned into Resistance a day later and the price has been trading below it ever since. The 1D MA50 (blue trend-line) broke only marginally recently but still made a Lower High on the Channel and the price dropped sharply.
Since that drop however, the pair has held the previous Low/ Support of May 12 and on June 15 it made a bounce there, potentially making it a Double Bottom formation. We can see the difference in structure with the failed Double Bottom on April 13. What further enhances the likelihood of a bullish break-out is the 1D RSI which has been on Higher Lows since April 28.
As a result, a break above the Channel Down (Lower Highs) should target the 0.382 Fibonacci retracement level around 1.07865, which is the May 30 (Lower) High and current Resistance. Most likely by the time of that test, the 1D MA100 would be there. A 1D candle close above it, will most likely target the 0.618 Fib (around 1.10580) and the 1D MA200 (orange trend-line).
In contrast, a 1D candle close below the 1.03470 Support, should extend the technical trading within the Channel Down and target a new Lower Low on the -0.236 Fibonacci extension near 1.000.
Tradingview link:
https://www.tradingview.com/chart/EURUSD/yJii2c3E-EURUSD-High-chances-of-finally-turning-bullish