

- June 22, 2022
- Posted by: Tradingshot Articles
- Category: Forex
The USDRUB pair hit this week the lowest levels since June 2015, marking a remarkable turnaround for the Ruble (drop on the pair around -65%) since the March 2022 High at the peak of the Russia – Ukraine invasion.
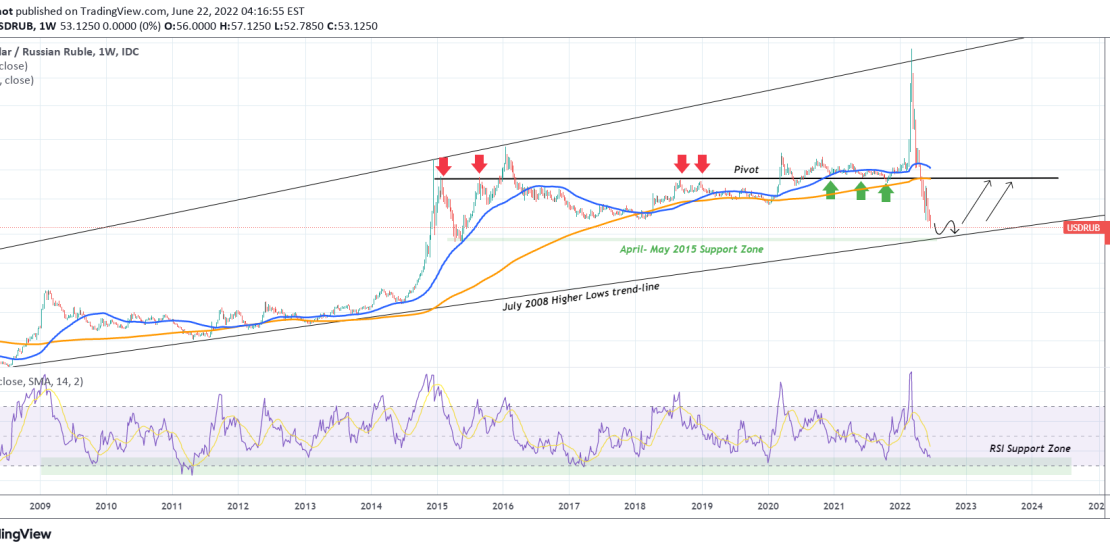
With this massive drop, the pair is getting very close to the Higher Lows trend-line that started during the subprime mortgage crisis in the U.S. on July 2008. This chart is on the 1W time-frame (log), with the RSI also approaching its own multi-year Support Zone. With the April – May 2015 Support Zone (made during another period of huge uncertainty in Russian economy) also close around 49.00, it is obvious that the price is near the most significant long-term Support cluster.
As a result, our long-term strategy on the pair has turned heavily bullish, targeting at first the Pivot trend-line (71.00) that should act as the first Resistance. The pattern is invalidated if we get a monthly candle closing below the 2008 Higher Lows trend-line.
Tradingview link: