

2022
-
GBPNZD Confirmed long-term buy
- September 28, 2022
- Posted by: Tradingshot Articles
- Category: Forex
No Comments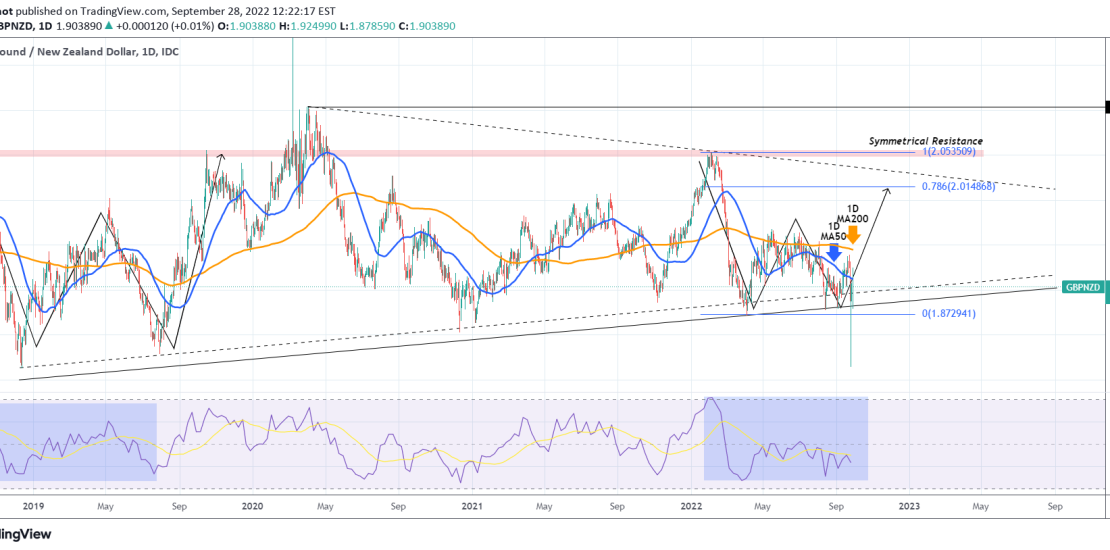
The GBPNZD pair has been following exactly our trading plan since our last update a month ago, getting rejected on the 1D MA200 (orange trend-line) and hitting the Higher Lows zone of the long-term Triangle pattern that it has been trading in since the April 02 2020 High: Following the initial rebound after the
-
WTI OIL Buy Signal on RSI Support bounce
- September 28, 2022
- Posted by: Tradingshot Articles
- Category: Commodities
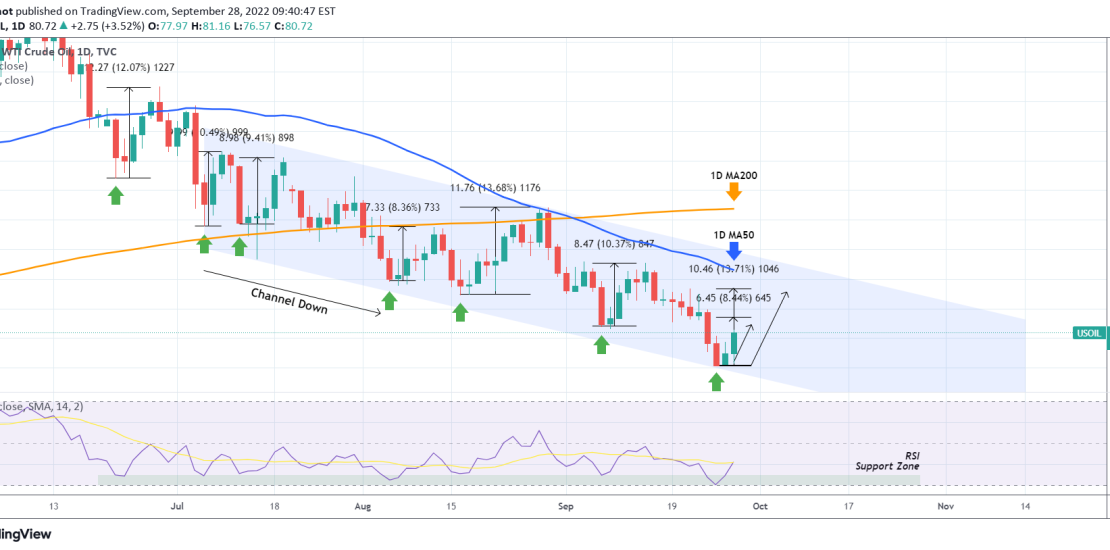
The WTI Oil (USOIL) has been trading within a Channel Down pattern since early July. A key characteristic of that formation is that every time the 1D RSI entered its 35.50 – 30.00 Support Zone, the price rallied short-term on an increase ranging from +8.40% to +13.70%. Two days ago the RSI hit the
-
XAUUSD Strong buy signal ahead
- September 28, 2022
- Posted by: Tradingshot Articles
- Category: Commodities
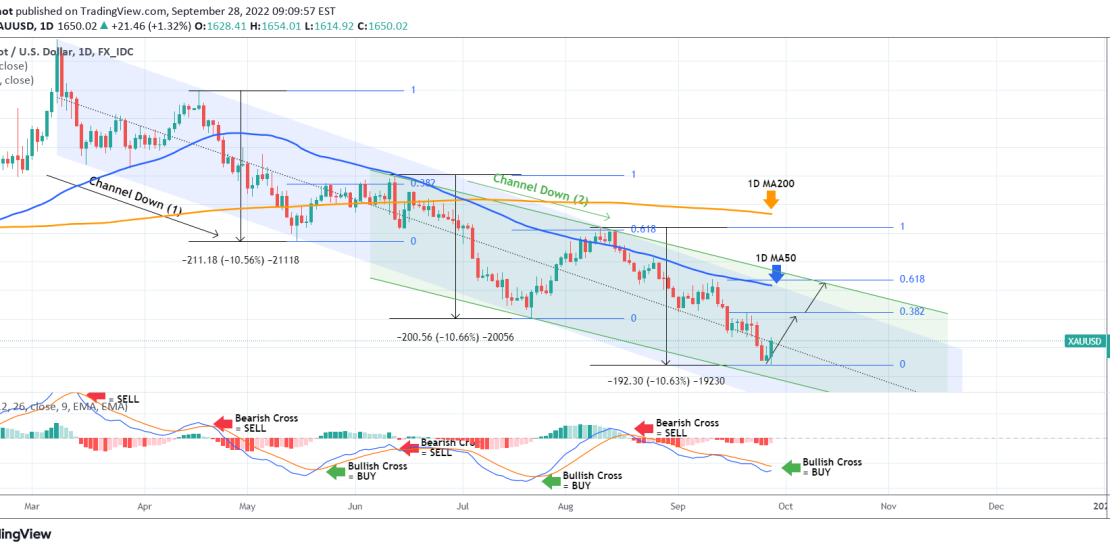
Gold (XAUUSD) has been trading within a long-term Channel Down (1) since the March 08 2022 High caused by the Ukraine – Russia war. A distinct characteristic of this pattern is that its Lower Lows completed a -10.50% decline from the previous Lower High. Today’s low completed another -10.50% decline from the August 10
-
GBPCHF Best long-term buy signal since COVID
- September 27, 2022
- Posted by: Tradingshot Articles
- Category: Forex
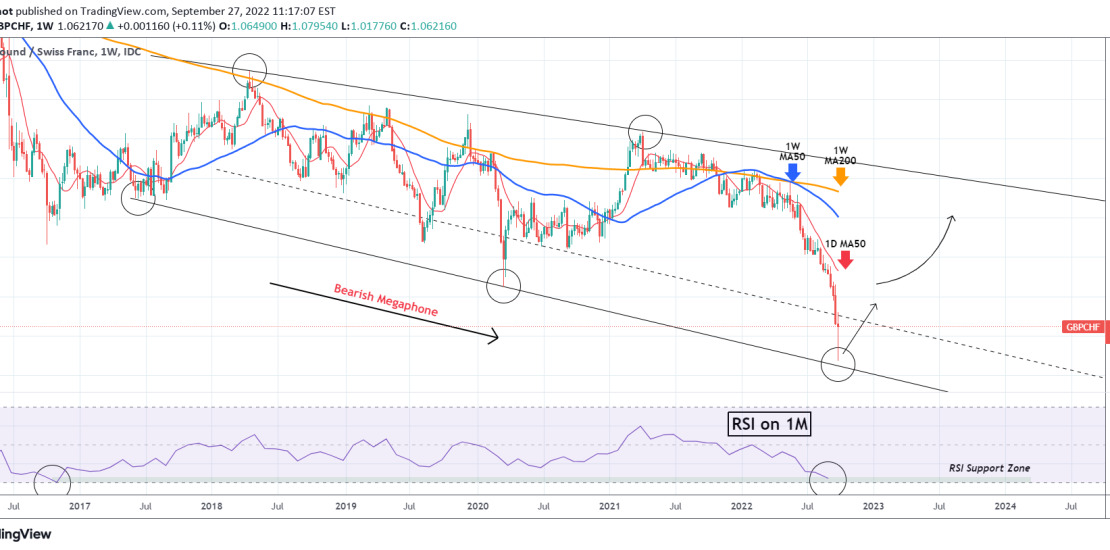
The GBPCHF pair almost hit early this week the Lower Lows trend-line of the multi-year Bearish Megaphone pattern that it has been trading in since June 05 2017. At the same time, the RSI on the 1M time-frame printed its lowest value since the October 31 2016 candle. This combination is a strong buy
-
DOW JONES Oversold but that alone not enough for a buy
- September 27, 2022
- Posted by: Tradingshot Articles
- Category: Stock Indices
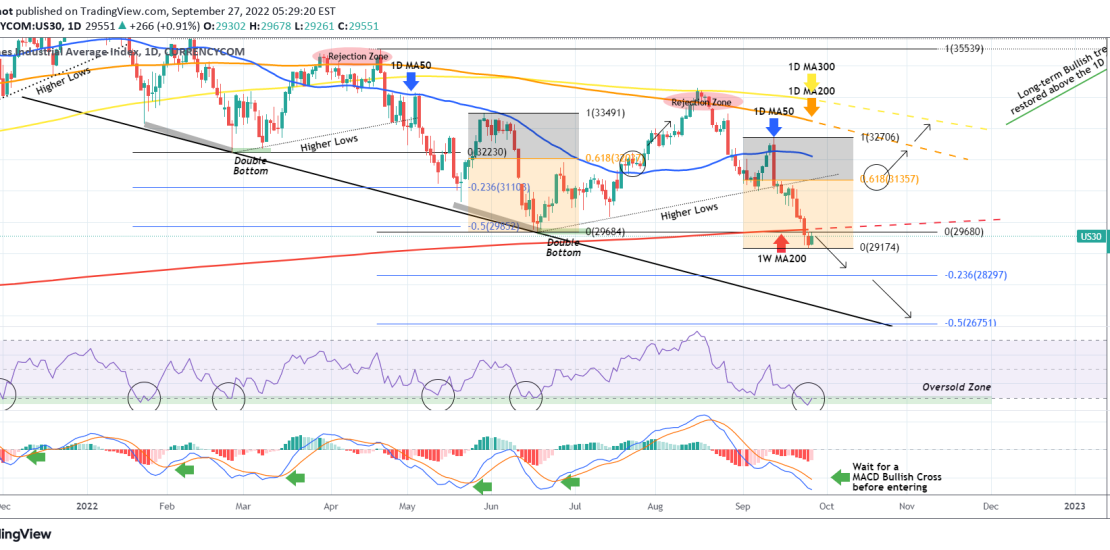
The Dow Jones Industrial Average (DJI)broke and closed last week below its 1W MA200 (red trend-line), for the first time since the week of May 11 2020, a very bearish sign on its own. Based on what the index did on May 09 2022 after breaking the previou Support (Double Bottom), the price now
-
S&P500 Is this the last Support standing??
- September 26, 2022
- Posted by: Tradingshot Articles
- Category: Stock Indices
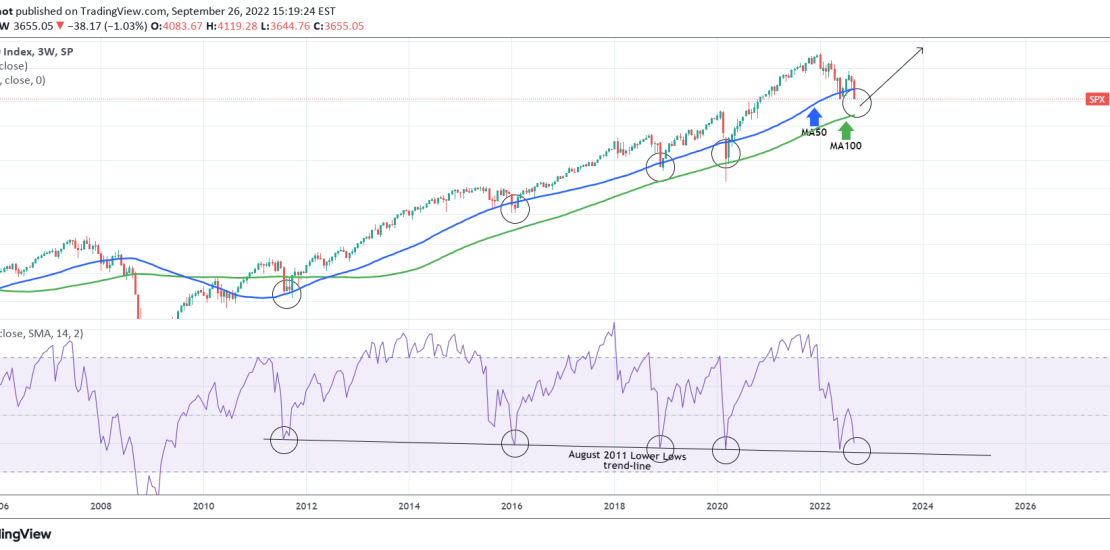
The S&P500 index (SPX) has been pulling back again considerably since the mid-August High, which still was a Lower High within the current Bear Phase. A very consistent pattern that throughout this prolonged, multi-year Bull Cycle has offered the best buy entries possible, can be seen on the 3W time-frame. The signal is given
-
DAX Lower bottom and recovery signal on 8-year pattern
- September 26, 2022
- Posted by: Tradingshot Articles
- Category: Stock Indices
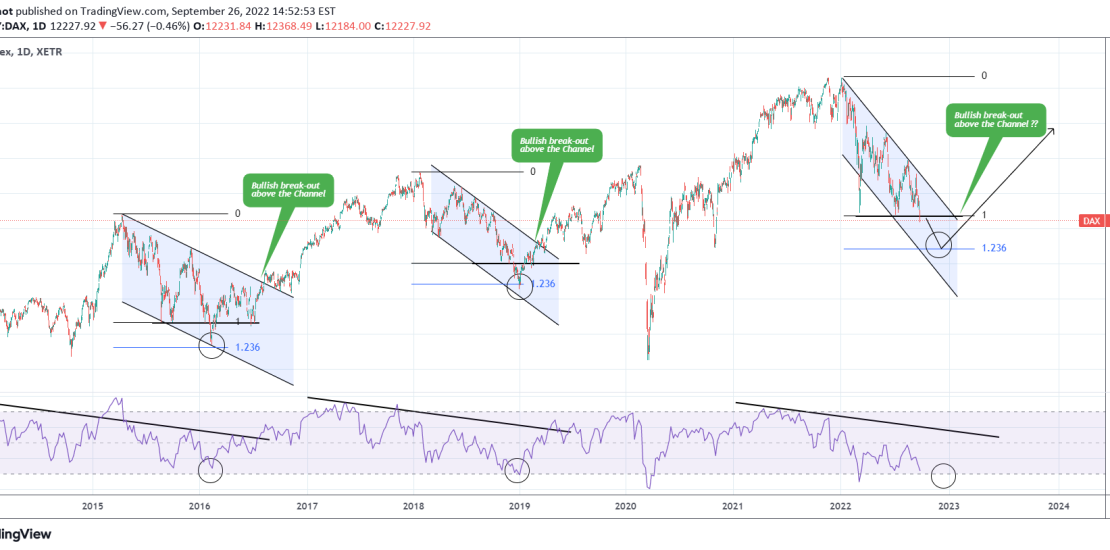
The German stock index (DAX) has been trading under Lower Highs ever since the late December All Time High (ATH). Ignoring the March 08 2022 breach due to the Ukraine – Russia war, the pattern is a Channel Down. The last two times DAX traded within a Channel Down was for the whole year
-
XAUUSD Channel Down bottomed. Potential short-term buy.
- September 26, 2022
- Posted by: Tradingshot Articles
- Category: Commodities
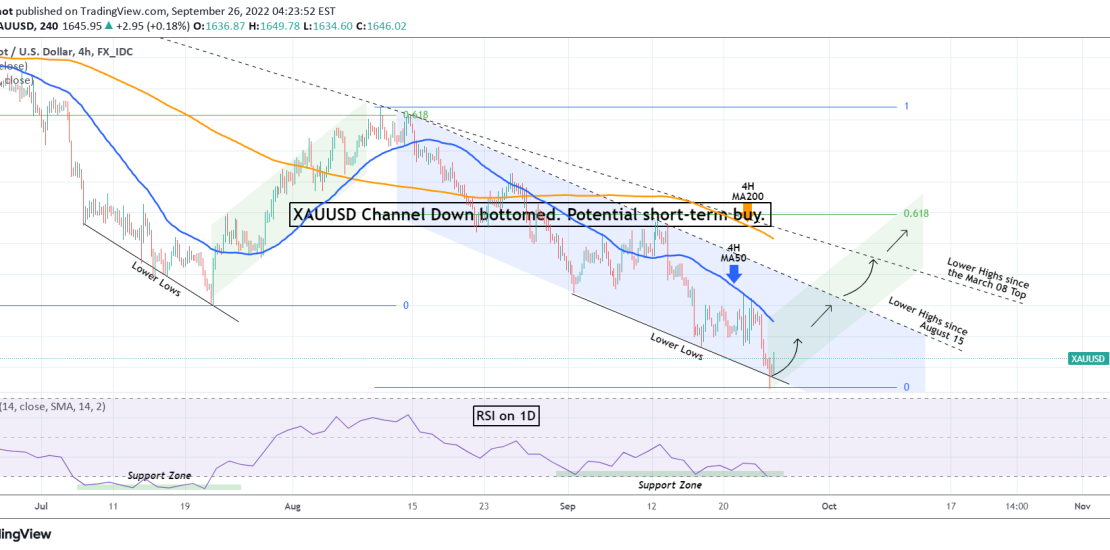
Gold (XAUUSD) following the rejection on the 4H MA50 (blue trend-line), which is the short-term Resistance, hit and even marginally broke today, the bottom (Lower Lows trend-line) of the Channel Down since the August 10 High, which technically defines the medium-term bearish trend. The recent Lower Lows though have been formed while the RSI
-
EURUSD Expected rebound on the bottom of the Channel Down
- September 26, 2022
- Posted by: Tradingshot Articles
- Category: Forex
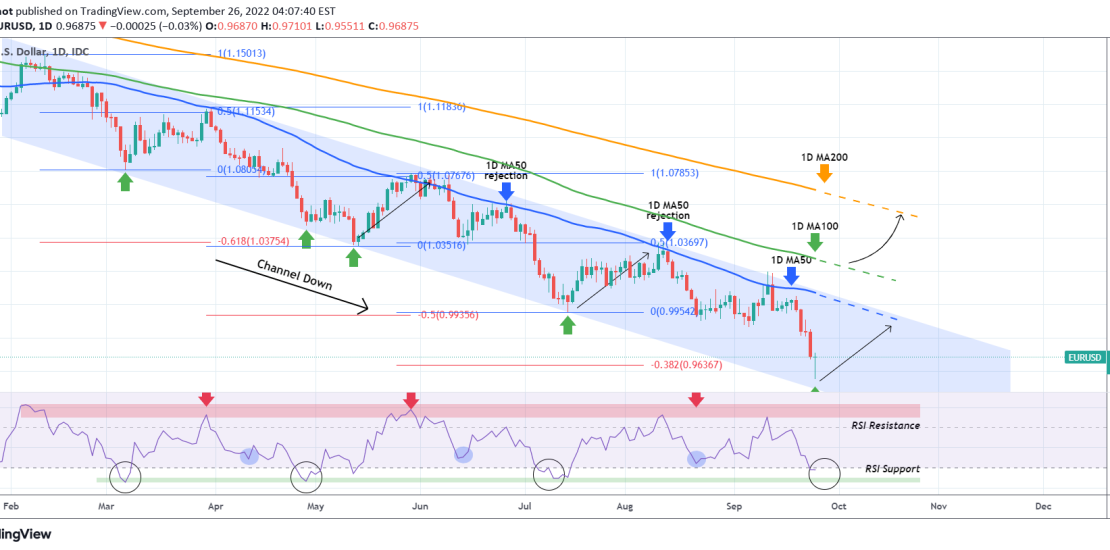
The EURUSD pair has been trading within a Channel Down pattern since the February 10 High. Time and time again we have pointed out the recurring buy/ sell levels within this pattern due to its strong symmetry both on the price action and the RSI on the 1D time-frame, which provided the following accurate
-
BITCOIN The S&P tests MA200. Crucial week ahead for BTC.
- September 25, 2022
- Posted by: Tradingshot Articles
- Category: Cryptocurrency
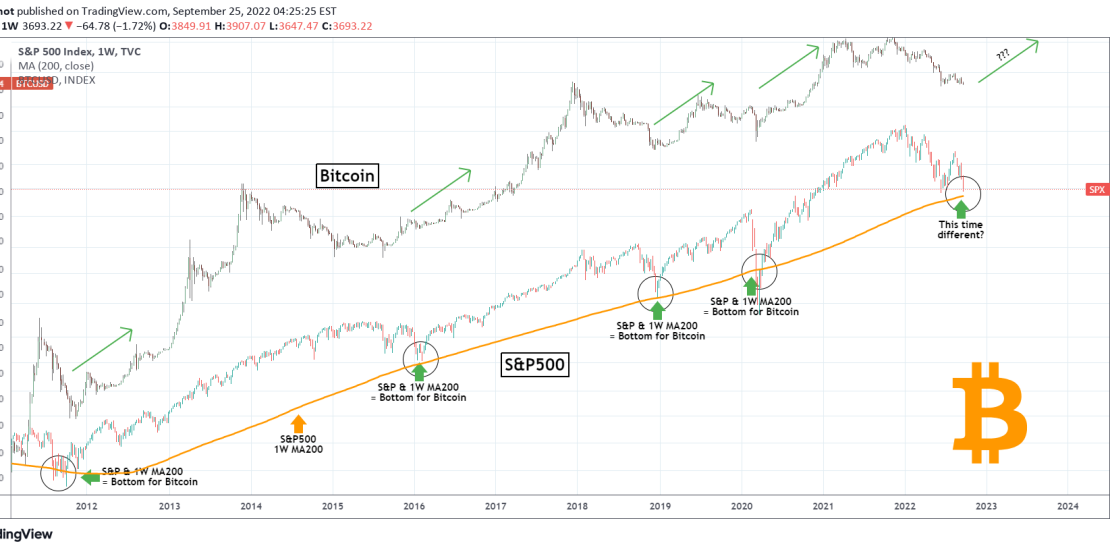
Simple 1W chart. Every time the S&P500 index (SPX) hit and broke above or (nearly) bounced on its 1W MA200 (orange trend-line), Bitcoin has formed a bottom and started along with the S&P rally phases. This week the S&P500 will have an opportunity for such a test. Will it find Support and cause Bitcoin