

- August 1, 2022
- Posted by: Tradingshot Articles
- Category: Forex
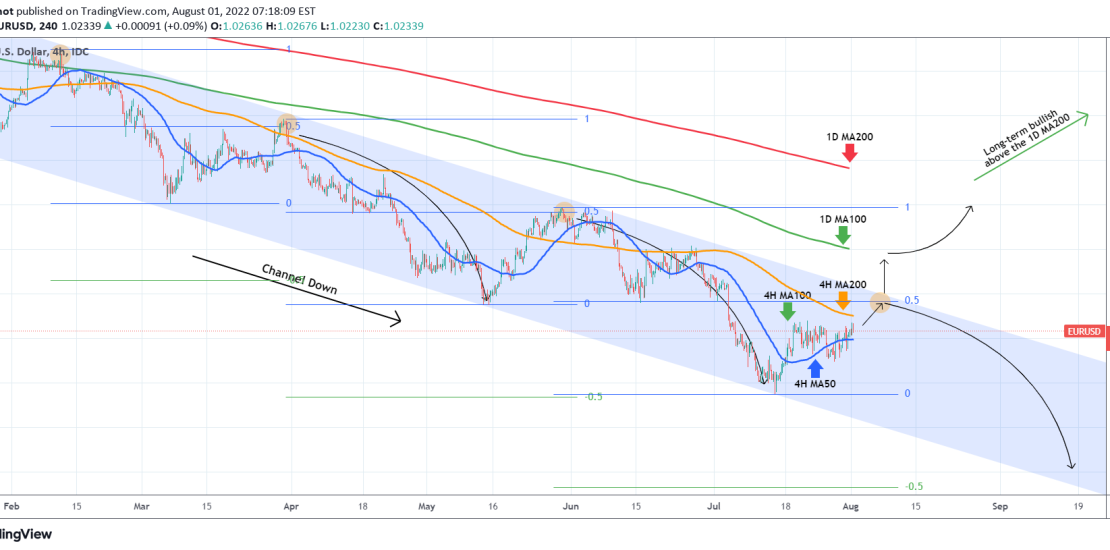
The EURUSD pair continues to trade sideways around the 4H MA50 (blue trend-line), keeping all this time the trend within the strict boarders of the long-term Channel Down pattern since the February 10 High.
As this pattern shows, which I’ve been analyzing on all recent posts, every Lower High is always priced above the 4H MA200 (orange trend-line) and just over the 0.5 Fibonacci retracement level between the prior Lower High and the last Lower Low. That value is now at 1.0367 and should be the short-term target (or break-out target when 4H MA200 breaks).
After that, the long-term pattern shows that it is best in R/R terms to go on a tight medium-term sell, targeting the -0.5 Fibonacci extension, which is where all previous Lower Lows where formed. SL tight just outside the Channel Down, so that if we get a 1D candle close above, reverse to buying towards the 1D MA100 (green trend-line), which is untouched since February 10.
Keep in mind that the only trend-line that hasn’t been hit in the past 13 months (since June 17 2021 to be exact), is the 1D MA200 (red trend-line) and that is the trend-line you want to see break if you want a long-term trend change to bullish.
Tradingview link:
https://www.tradingview.com/chart/EURUSD/zGwdZfKJ-EURUSD-going-for-a-1-0367-High