

- August 3, 2022
- Posted by: Tradingshot Articles
- Category: Commodities
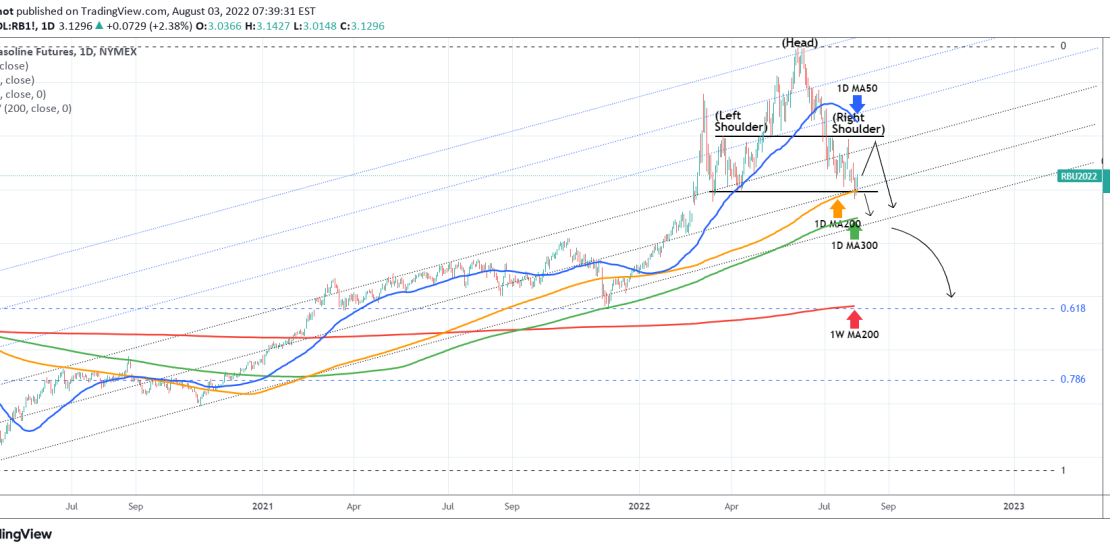
Gasoline (RB1!) has been rising since the March 2020 bottom on a straight Channel until late February 2022 where war and inflation worries turned it parabolic as illustrated by the use of the Fibonacci Channel extensions. Following the June 06 market top, a Head and Shoulders (H&S) pattern was formed that hit (and so far rebounded on) the 1D MA200 (orange trend-line), a level touched for the first time since December 23 2021.
A break below the Support, should target the lower extension of the 1D MA300 (green trend-line), if not a retest of the Shoulder Resistance and potentially rejection on the 1D MA50 (blue trend-line) would initiate the 1D MA300 drop.
This trend-line has been Gasoline’s Support since December 08 2020. This however may be the perfect opportunity to break it finally as the H&S pattern typically end such parabolas in fashion to at least the 0.618 Fibonacci Retracement level. Interestingly enough, that happens to be currently on the 1W MA200 (red trend-line).
Tradingview link: