

- October 25, 2021
- Posted by: Tradingshot Articles
- Category: Other
No Comments
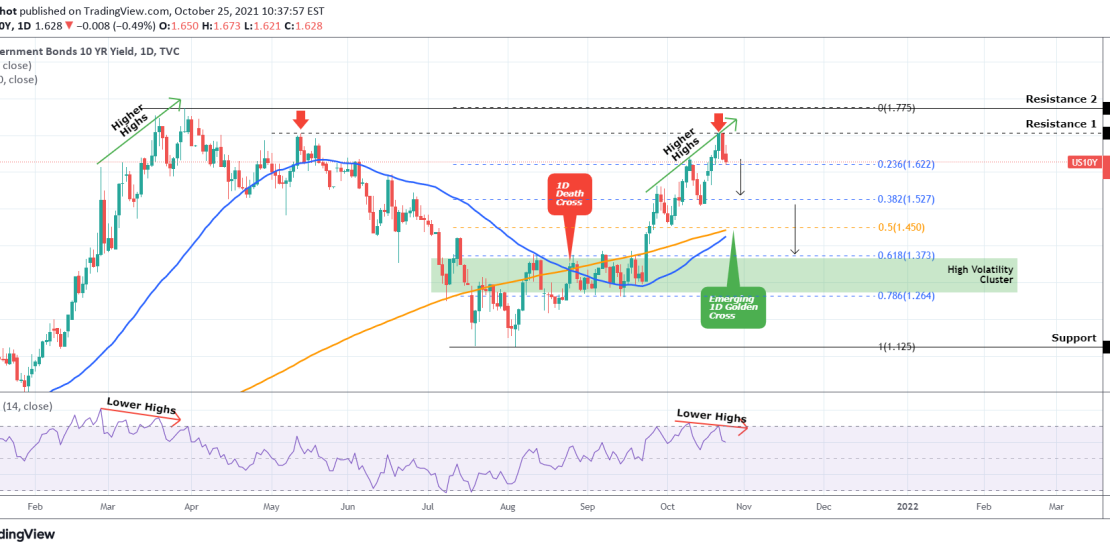
The US10Y has reached (and so far got rejected on) the 1.707 Resistance (1), which last time rejected the price on May 13. With the 1D RSI on a Bearish Divergence (is on Lower Highs while the actual price is on Higher Highs), similarities can be made with the February 25 – March 30 sequence, which after an RSI Bearish Divergence got rejected on the 1.775 Resistance (2) and essentially started the correction towards the 1.125 Support.
We are expecting a pull-back towards the 0.382 Fibonacci Retracement level and if broken the 0.618 level which may be even more likely as it is the top of the recent High Volatility Cluster.
Tradingview link:
https://www.tradingview.com/chart/US10Y/gX1t488Q-US10Y-Signs-of-a-bearish-reversal