
-
BITCOIN Weekly RSI has bottomed and leads the way to 19k first.
- November 29, 2022
- Posted by: Tradingshot Articles
- Category: Cryptocurrency
No Comments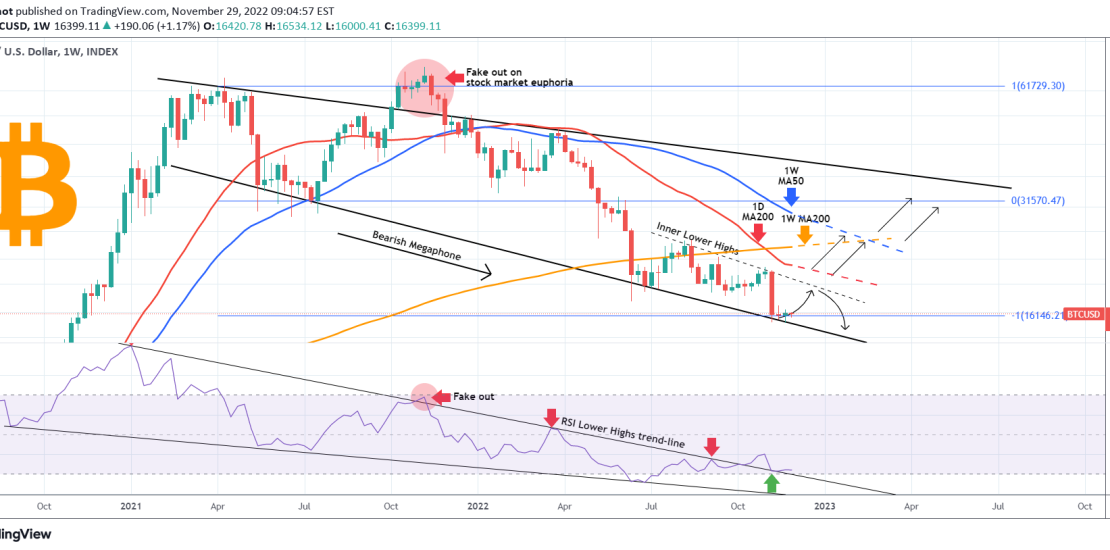
This is Bitcoin (BTCUSD) on the 1W (weekly) time-frame. The focus is on the Bearish Megaphone that has been running since the April 12 2021 High, drawn on the weekly candle bodies, ignoring the wicks. This is the pattern that has been dominating the whole Bear Cycle since its beginning, with the October –
-
BITCOIN If this level holds, expect 50k on the next rally.
- November 25, 2022
- Posted by: Tradingshot Articles
- Category: Cryptocurrency
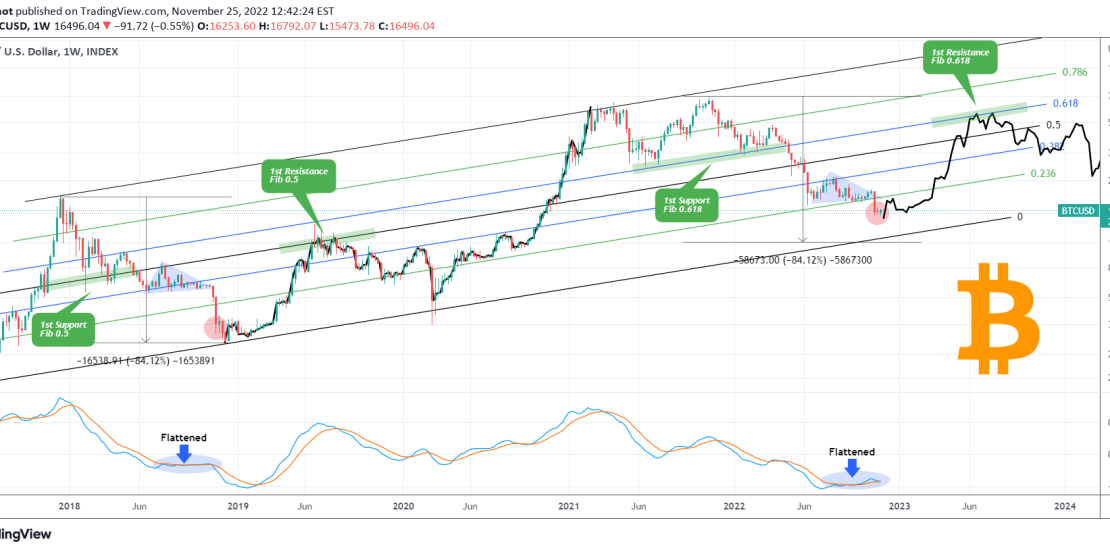
This is an interesting finding on the 1W time-frame, showing Bitcoin (BTCUSD) within a Channel Up since December 2017 High (of the previous Cycle). Below we analyze frame by frame the similarities and differences, key pressure levels and how those can make a projection for the following months. ** Triangle.. then flush ** A
-
BITCOIN Huge volume signaling the end of the Bear Market?
- November 22, 2022
- Posted by: Tradingshot Articles
- Category: Cryptocurrency

Two weeks ago, we saw the strongest weekly volume in more than a year, fueled by the collapse of FTX. This is a good opportunity to historically examine the effect of such huge volume spikes on Bitcoin (BTCUSD). On this 1W chart, we see that such volume spikes tend to be associated with trend
-
BITCOIN The Fib-Dollar Cheat sheet says the bottom is formed
- November 20, 2022
- Posted by: Tradingshot Articles
- Category: Cryptocurrency
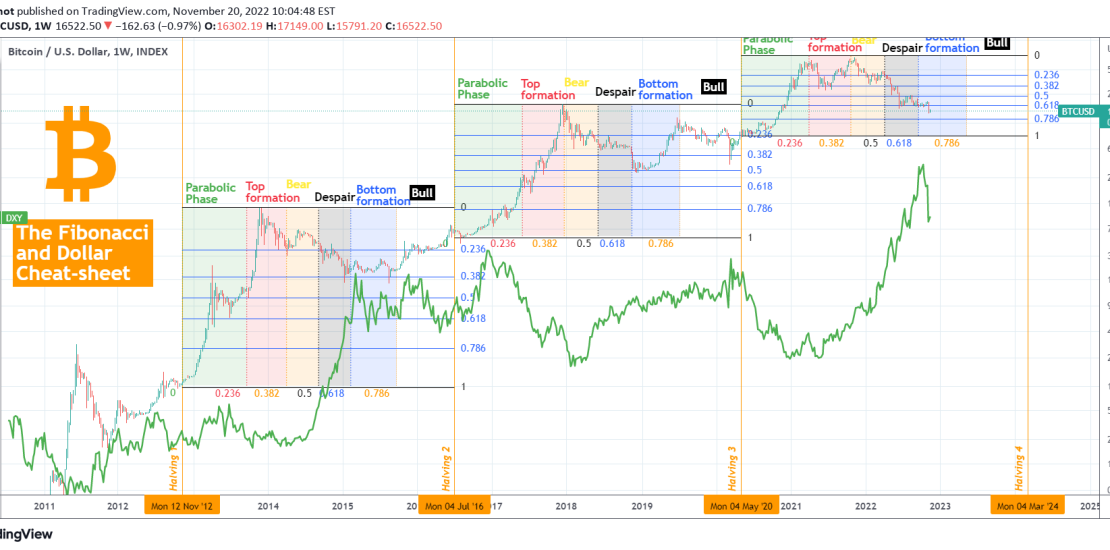
This analysis is centered around Bitcoin’s (BTCUSD) Halvings and their important to the market due to the supply shock they fundamentally deal and have done so historically and the U.S. Dollar Index (DXY being the green trend-line). On this 1W time-frame, we’ve applied time and horizontal Fibonacci levels on each Halving Cycle, from start
-
OKX Token is a better buy than BNB, KCS and CRO !
- November 18, 2022
- Posted by: Tradingshot Articles
- Category: Cryptocurrency
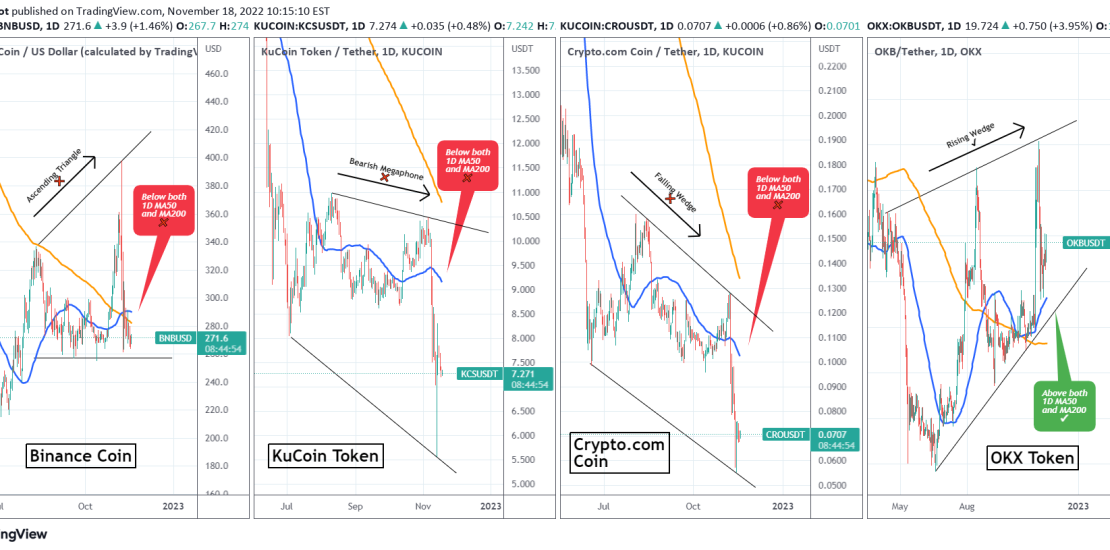
We’ve been seeing a lot of pain in the market lately, which is of course fueled by the FTX bankruptcy and the aftermath it is having on the crypto world. The native tokens of exchanges in particular have taken big hits. We wanted to take this opportunity to compare the tokens of 4 major
-
BITCOIN Bollinger W rebounding, does it mean the bottom is near?
- November 16, 2022
- Posted by: Tradingshot Articles
- Category: Cryptocurrency

Bitcoin (BTCUSD) on the 1W time-frame is flashing some bottom signals we can’t ignore. The core of this post is the Bollinger Bands Width (BBW) indicator which rebounded on a level (blue line) that has historically preceded major rallies and market bottoms (circles). The period that bears more resemblance with today is the BBW
-
SNXUSD Short-term bullish, major break-out Jan 2023!
- November 15, 2022
- Posted by: Tradingshot Articles
- Category: Cryptocurrency
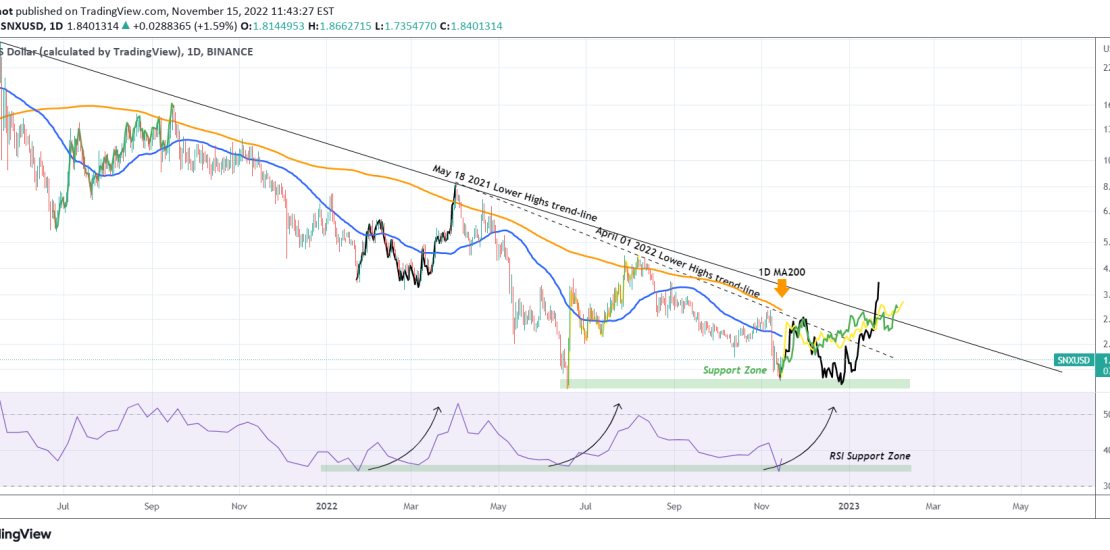
The Synthetix Network token (SNXUSD) is having a very bullish day following the rebound on the June Support Zone. Being still restrained below two Lower High Resistances, April 01 2022 and May 18 2021, this is a short-term rebound that targets the 1D MA200 (orange trend-line). However, having rebounded on the 1W RSI Support
-
STXUSD Rebound contained below the 1D MA100
- November 15, 2022
- Posted by: Tradingshot Articles
- Category: Cryptocurrency

Stacks (STCUSD) has had a +50% rebound on today’s peak but we see the effect retracing as it almost hit the 1D MA100 (green trend-line). As long as it fails to close a candle above it, expect a Lower Low within the Channel Down pattern that it has been trading in since May 31.
-
BITCOIN Is the FTX crash similar to 2015 Bitfinex??
- November 14, 2022
- Posted by: Tradingshot Articles
- Category: Cryptocurrency

This is Bitcoin (BTCUSD) on the 1W time-frame, on the left displaying the 2021 – 2022 price action while on the right the 2014 – 2015. For the record we need to make clear that FTX crashed and filed for bankruptcy while Bitfinex on August 17 2015 experienced a flash crash. At the time,
-
XRPUSD Another buy opportunity for medium-term traders.
- November 12, 2022
- Posted by: Tradingshot Articles
- Category: Cryptocurrency
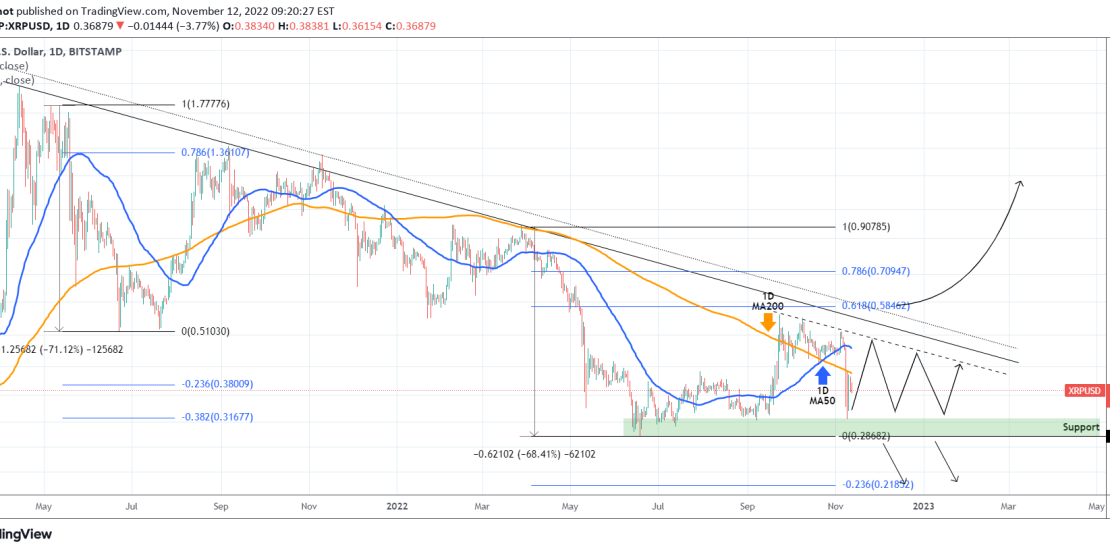
XRPUSD eventually followed the trading plan we posted on September 16 as it broke above its (former) Triangle, hit the 1D MA200 (orange trend-line target and almost touched the 0.618 Fibonacci retracement level: The rise however was contained just within the May 2021 Lower Highs trend-line, which is the Bear Cycle’s Resistance. Even though
