

- November 12, 2022
- Posted by: Tradingshot Articles
- Category: Cryptocurrency
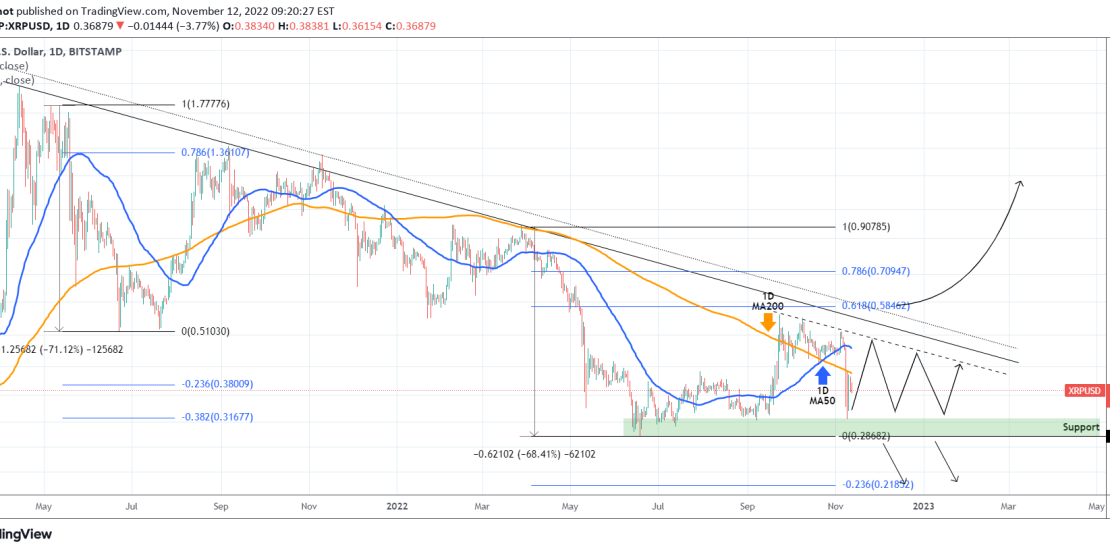
XRPUSD eventually followed the trading plan we posted on September 16 as it broke above its (former) Triangle, hit the 1D MA200 (orange trend-line target and almost touched the 0.618 Fibonacci retracement level:

The rise however was contained just within the May 2021 Lower Highs trend-line, which is the Bear Cycle’s Resistance. Even though the 1D MA200 was supporting, the recent events with FTX sold the price aggressively along with the whole crypto market and pulled it back to the top of the mid-June Support Zone. On the medium-term, this can be another buy opportunity in disguise. There is a (dashed) Internal Lower Highs trend-line to target and then we can either wait for a new pull-back to buy confidently when the 2021 Lower Highs trend-line or better yet the 0.618 Fib break. On the other had, we can sell if the price breaks below the 0.28680 Support and target the -0.236 Fib extension.
Tradingview link: