

- November 20, 2022
- Posted by: Tradingshot Articles
- Category: Cryptocurrency
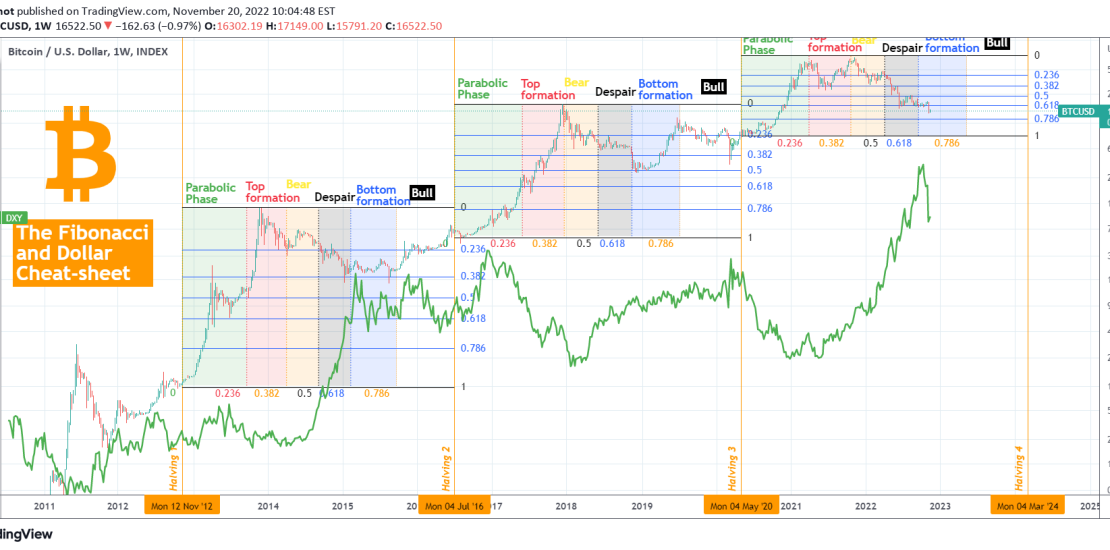
This analysis is centered around Bitcoin’s (BTCUSD) Halvings and their important to the market due to the supply shock they fundamentally deal and have done so historically and the U.S. Dollar Index (DXY being the green trend-line). On this 1W time-frame, we’ve applied time and horizontal Fibonacci levels on each Halving Cycle, from start to end, to classify the different phases that BTC has traded and determine where we are at now (always based on the model).
** The Time Fibonacci levels **
As you see, the price tends to rally aggressively after each Halving (Fib 0.0) until Fib 0.236. We classify this as the Parabolic Phase.
From Fib 0.236 to 0.382, BTC tends to make the final rally and forms its Cycle Top. We classify this as the Top formation.
From Fib 0.382 to 0.5, BTC has officially entered Bear Market territory. We classify this as the Bear Phase.
From Fib 0.5 to 0.618, BTC is in the final staged of the Bear Cycle, preparing for its last (and most aggressive) fall. We classify this as the Despair Phase.
From Fib 0.618 to 0.786, BTC traditionally forms the Bottom of the Cycle, signaling the end of the Bear Market. We call this the Bottom formation phase.
From Fib 0.786 to 1.0 (next Halving), BTC officially starts the new Bull Market. Categorization: Bull.
** The horizontal Fibonacci levels **
Those are measured from the bottom of the Halving candle to the top of each Cycle. Those are mostly useful in calculating a potential bottom level. The first Cycle bottomed after the 0.382 Fib broke. The second Cycle bottomed after the 0.5 Fib broke (a Fib level lower than the previous Cycle), while the current Cycle has already broken Fib 0.618 (a Fib level lower than the previous Cycle).
Not surprisingly, this recent (FTX led) low is timed right within the ‘Bottom formation’ Phase (blue zone). In the 2018/19 Cycle, the price rebounded relatively early after the ‘Bottom formation’ Low, while in 2014/15 in did so towards its end. The phase’s end is in May 2023.
** The Dollar’s importance **
Among all the Fibs and classifications, the USD Index (DXY) plays its own highly important role during BTC’s Cycles. Right now the DXY has been on a +1 month (aggressive) decline. Typically, as it is valued in USD, Bitcoin tends to rise when the DXY falls. The stop of USD’s previous run was in March 2020, right on the COVID crash. What Bitcoin did then was bottom out and start the 2020/21 Parabolic rally. The previous USD top was on December 2016, when again Bitcoin was in its ‘Parabolic Phase’. The USD’s previous top was in March 2015, right at the start of the 2015 ‘Bottom formation’ phase.
From all the about, we could reach a (always with a certain degree of error/risk) conclusion that the combination of a new (fundamentally led/ FTX) Low within the “Bottom formation” phase of this Halving Cycle, while the DXY is dropping aggressively, could be Bitcoin’s new bottom. Whether the price rebounds now as in 2019 or twards the end of the phase as in 2015, it remains to be seen, and certainly depends on a lot of variable factors, most of which fundamental. Stability in the stock market is definitely among the top ones.
But what do you think? Has Bitcoin priced its new Cycle Bottom as this Halving model suggest, especially if the DXY is starting a new long-term decline? Or the global fundamentals are so strong that it will be invalidated? Feel free to let me know in the comments section below!
Tradingview link: