- April 7, 2019
- Posted by: Tradingshot Articles
- Category: Cryptocurrency

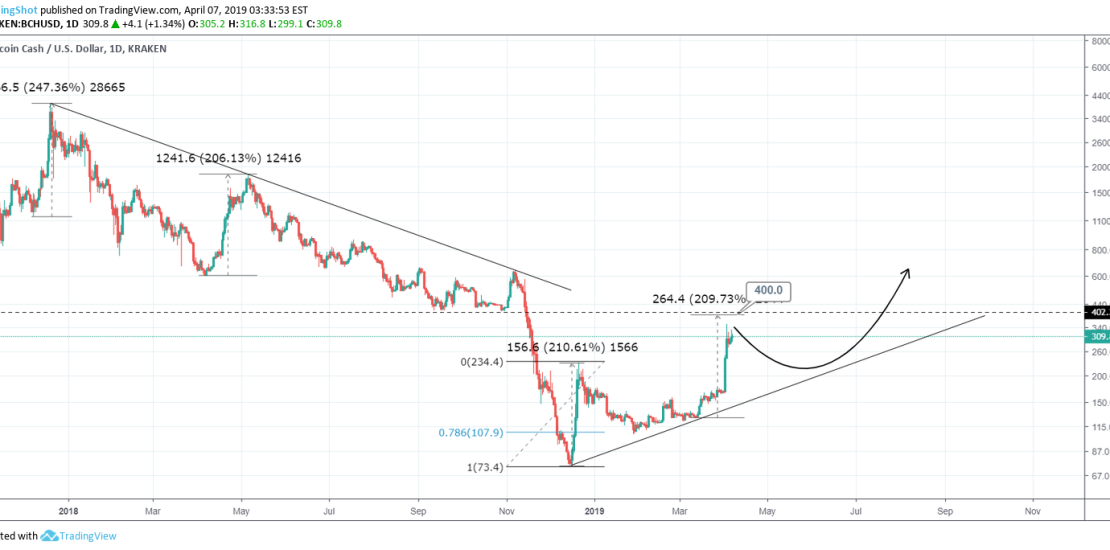
Not too complicated TA combinations on this one. Purely based on the fact that every +200% rise on BCH after the All Time Highs, ended with a decline. Obviously during the bear market the price broke the low, while since the December bottom, the sole +200% rise pulled back to its 0.786 Fibonacci.
If the current rise gets completed at +210% again, then that puts the top roughly at 400 before it pulls back again.
Notice how during the bear market, a fine Lower High trend line kept the selling pressure going on every spike (rejected every attempt to break it). Will we get similar, smooth Higher Low trend line this time to support every pull back?
Tradingview link:
https://www.tradingview.com/chart/BCHUSD/Slwx74hM-BITCOIN-CASH-eyes-400-before-a-pull-back/

