

- May 30, 2019
- Posted by: Tradingshot Articles
- Category: Cryptocurrency
No Comments
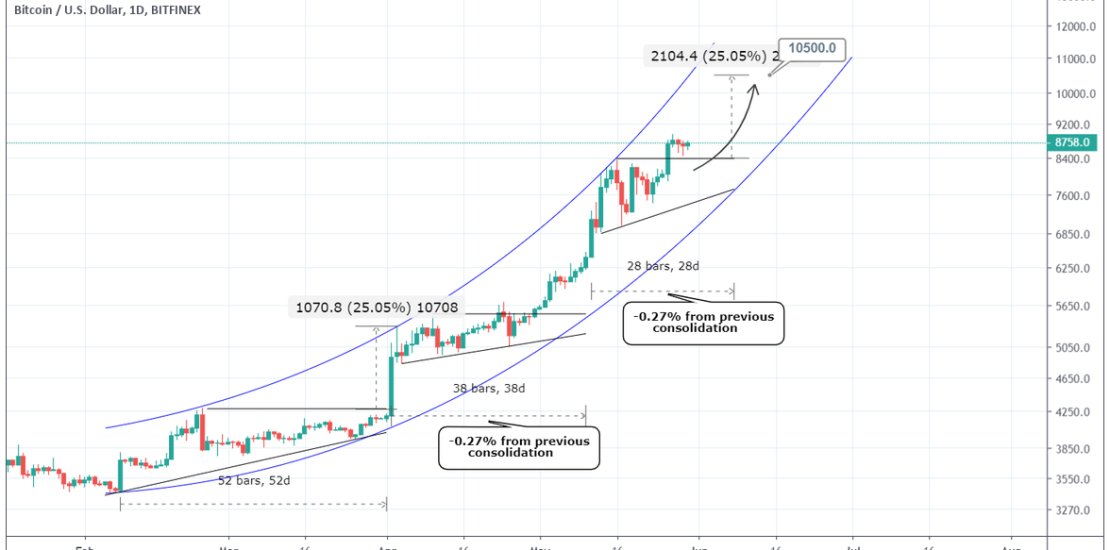
I have attempted to break down the current 4 month parabola into a strong sequence of patterns and what stands out is the Ascending Triangle.
Before each aggressive bullish candle sequence within the Parabola, BTC consolidated roughly within an Ascending Triangle formation. When that Triangle broke upwards, an aggressive new Top was made.
Assuming that each consolidation is on a -0.27% decreasing rate, then by the start of the 2nd week of June BTCUSD should make a new break to the upside. A minimum of +25% rise has been calculated, which sets the target at $10500.
Related material:

Tradingview link: