

- March 5, 2019
- Posted by: Tradingshot Articles
- Category: Cryptocurrency
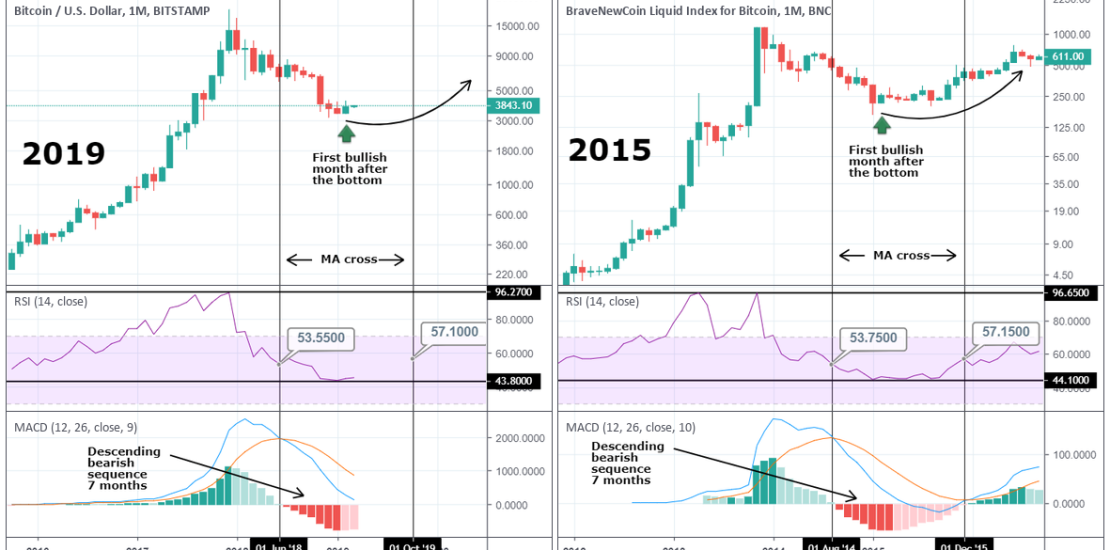
Similarities of now (2019) and then (2015) showing that the bottom is already in and after some months of consolidation we will start seeing higher and higher prices.
* RSI 2019: the RSI peaked at 96.2700 on the ATH then dropped to 43.800, near the level it is currently consolidating. The bearish MA cross took place with the RSI at 53.550.
2015: the RSI peaked at 96.6500 on the ATH then dropped to 44.100, where it consolidated until the bullish MA cross validated the start of the next bull market. The bearish MA cross took place with the RSI at 53.750.
* MACD 2019: After the bearish cross we had 7 straight months of descending bearish readings. The bearish cross took place with the RSI at 53.550.
2015: After the bearish cross we had 7 straight months of descending bearish readings. The bearish cross took place with the RSI at 53.750.
Technically the next bullish MA cross justifies the next bull market and should keep from now on an ascending bearish sequence until the cross. October 2019 can be the date. The RSI should be around 57.100.
For me we are trading on the most optimal buy levels and although Bitcoin will consolidate some more for a few months, such a long term opportunity most likely won’t come along again.
We should be looking at the bigger picture. The same picture that some took advantage of 4 years ago.


Tradingview link: