

-
XMRBTC Buy Signal
- March 13, 2020
- Posted by: Tradingshot Articles
- Category: Cryptocurrency
No Comments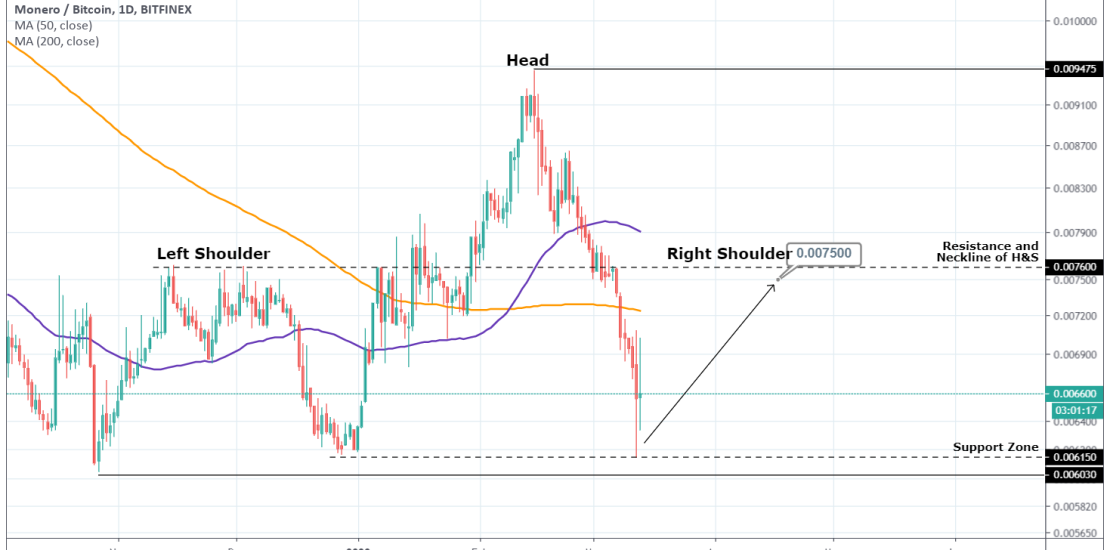
Pattern: Head and Shoulders on 1D. Signal: Bullish as the price hit the 0.006150 Support and should rebound to form the Right Shoulder. Target: 0.0075 (right below the Neckline). Tradingview link: https://www.tradingview.com/chart/XMRBTC/Samkau0J-XMRBTC-Buy-Signal
-
ETHBTC Buy Signal
- March 12, 2020
- Posted by: Tradingshot Articles
- Category: Cryptocurrency
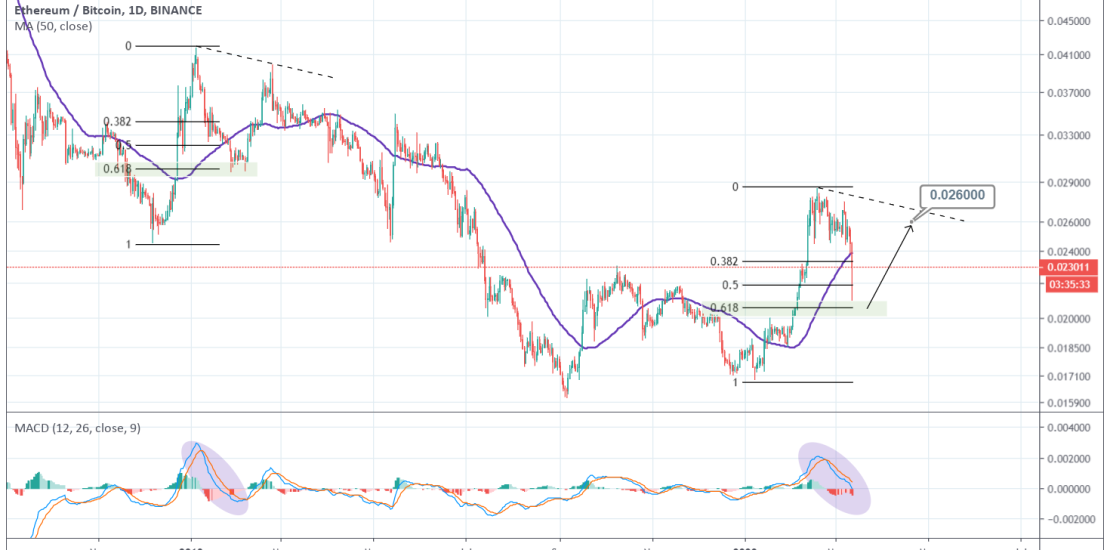
Pattern: Breakdown of parabolic rise. Signal: Bullish as the price has almost made a 0.618 Fibonacci retracement. Target: 0.02600. Tradingview link: https://www.tradingview.com/chart/ETHBTC/ZT7byJrA-ETHBTC-Buy-Signal
-
XRPUSD Still another 350 days of accumulation.
- February 28, 2020
- Posted by: Tradingshot Articles
- Category: Cryptocurrency
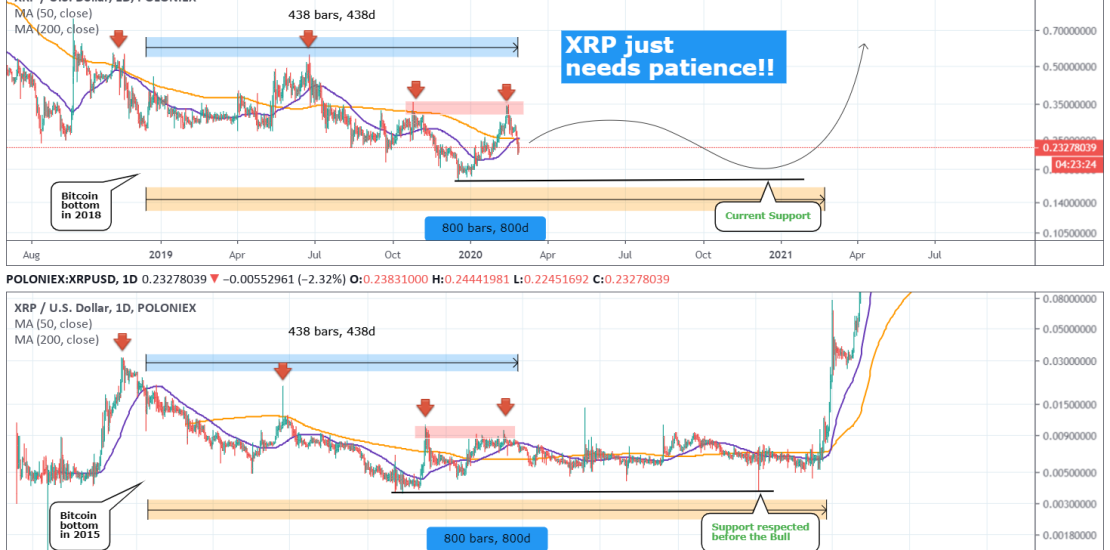
Ripple will get its chance to shine. There are few who argue the opposite. In this quick idea though I show why this time is not quite there yet. I have scaled XRP’s timeline based on Bitcoin’s Cycle from top to bottom. BTC’s bottom of the previous Bear Cycle was mid December 2018 and the
-
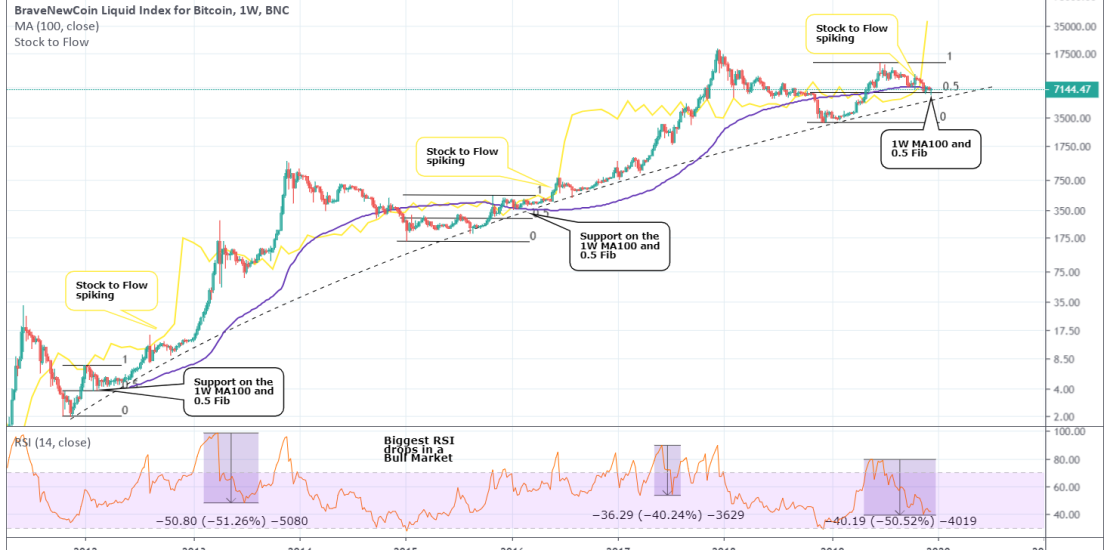
BITCOIN The Golden 51%-49% Ratio! 600 days of Bull Market left!
- February 22, 2020
- Posted by: Tradingshot Articles
- Category: Cryptocurrency
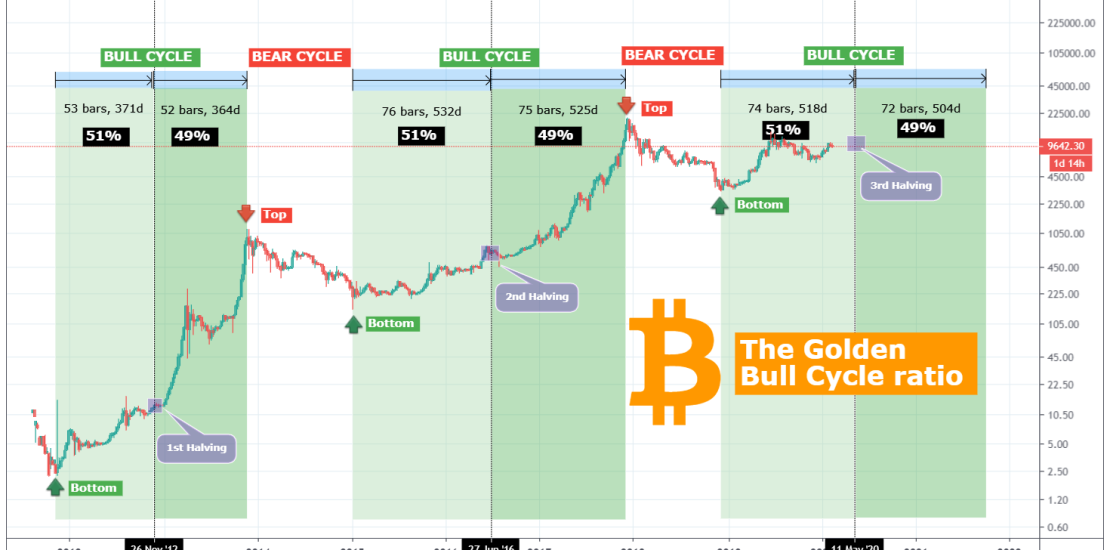
This is a really simple Bitcoin study on which I calculate the remaining days of the current Bull Cycle we are in based on the Top, Bottom and Halving of each Cycle. These parameters are effectively used to distinguish the Bull from the Bear Cycles. Tops are obviously where the Bull phase ends and Bear
-
XMRUSD Buy Signal
- January 15, 2020
- Posted by: Tradingshot Articles
- Category: Cryptocurrency
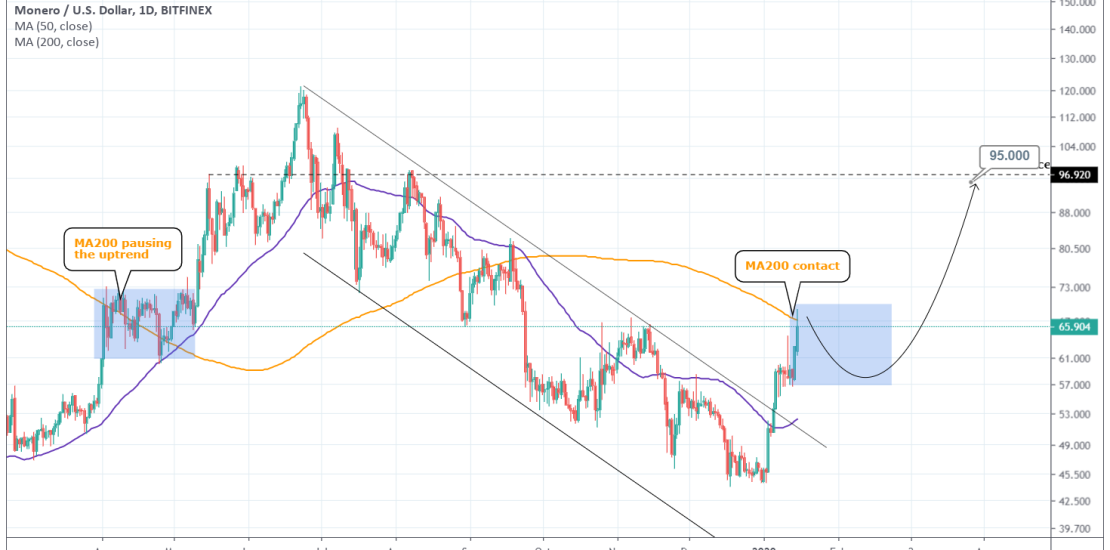
Pattern: Channel Down on 1W. Signal: Bullish as the Lower High trend line broke. If it fails to get detached from the 1D MA200, then expect a 1 month consolidation first. Target: 95.000. Tradingview link: https://www.tradingview.com/chart/XMRUSD/jB06ZNRJ-XMRUSD-Buy-Signal
-
BITCOIN Don’t worry about the ups and downs. Just accumulate!
- January 9, 2020
- Posted by: Tradingshot Articles
- Category: Cryptocurrency
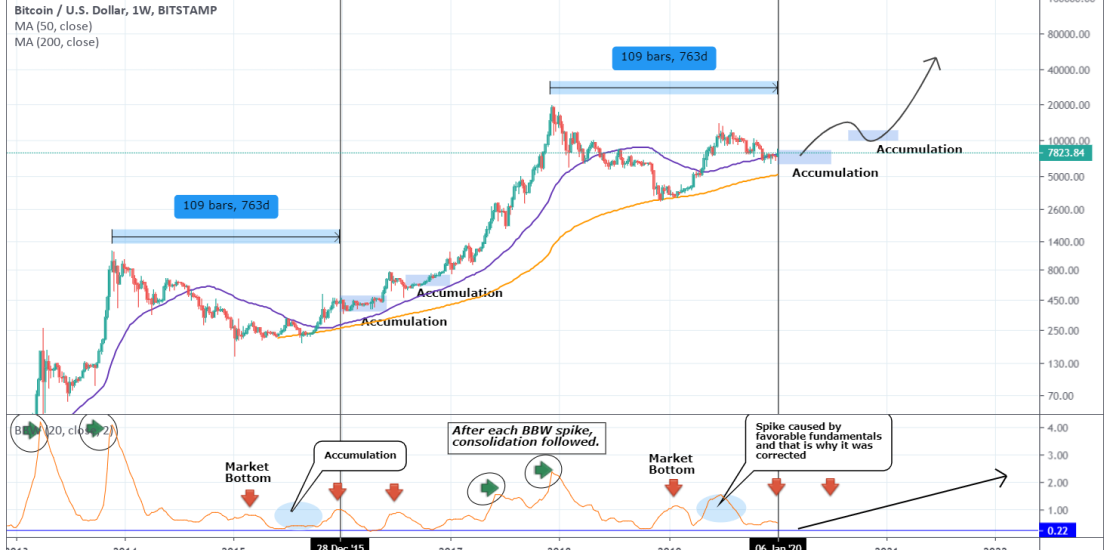
This will be a short analysis and the indicator I am using couldn’t make the picture much more clear. The Bollinger Bands Width (BBW), when Bitcoin is in a Bull Cycle, indicates periods of high volatility and accumulation. We see on the chart that at the moment the price is in on an extended
-
BITCOIN can test $20000. A 2020 year-end projection.
- January 4, 2020
- Posted by: Tradingshot Articles
- Category: Cryptocurrency
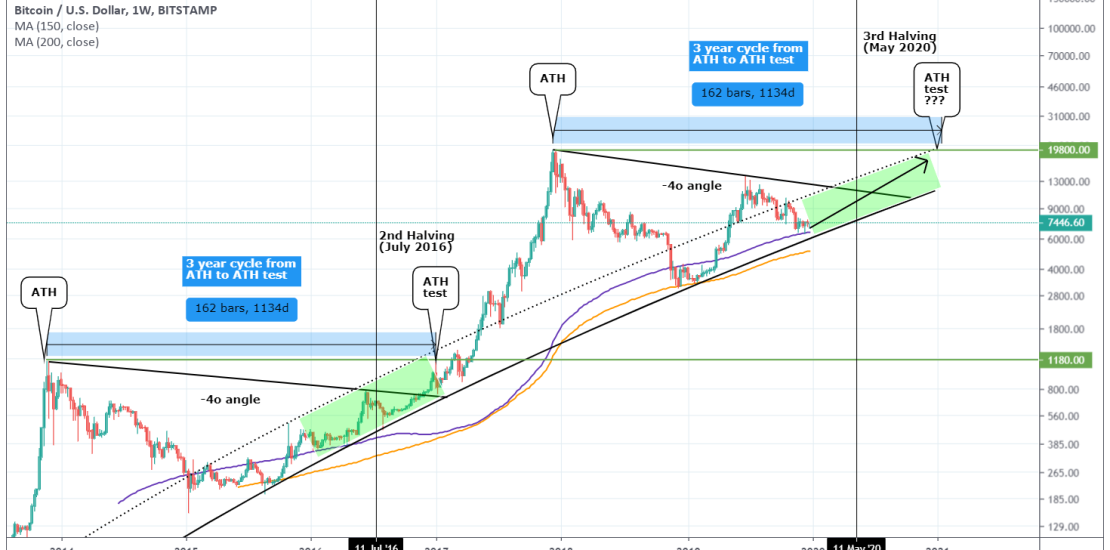
New year for Bitcoin and a whole new possibilities ahead. On this study I will share my 2020 year-end projection. There is no better place to start with than using the previous Bull Cycle, namely the start of it (2016 – 2017), as a reference point. *The time from All Time Highs (ATH) to ATH
-
XTZUSD Buy Signal
- January 3, 2020
- Posted by: Tradingshot Articles
- Category: Cryptocurrency
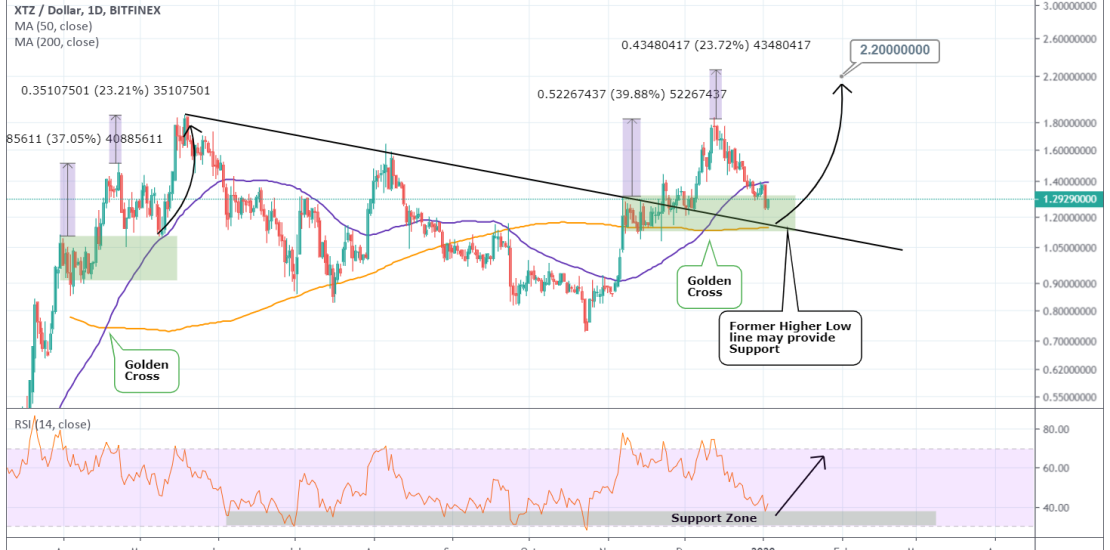
Pattern: Channel Down on 4H. Signal: Bullish as the price is approaching the former Higher Low line and the 1D MA200, both of which can provide Support. Target: 2.2000. Tradingview link: https://www.tradingview.com/chart/XTZUSD/v5N9uupS-XTZUSD-Buy-Signal
-
BITCOIN Cycle mean & preHalving BOTTOM. Best time to accumulate!
- December 24, 2019
- Posted by: Tradingshot Articles
- Category: Cryptocurrency
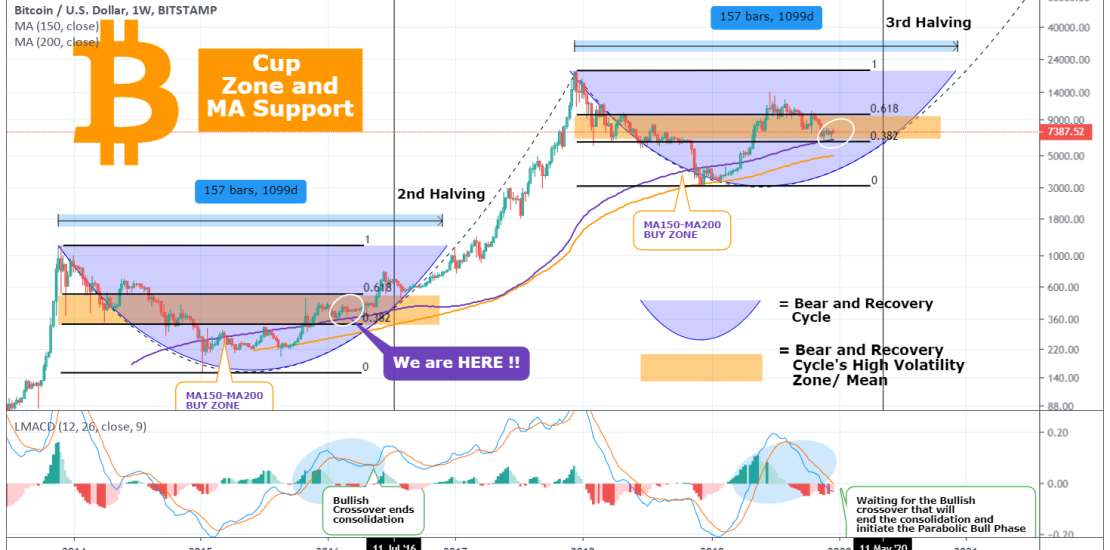
Before starting my analysis I want to wish everyone Merry Christmas! Now, I have made this chart in an attempt to put all correlating factors of Bitcoin’s previous and current cycle into perspective. The parameters that I am focusing on are the MA150/200, the Cycles’ High Volatility Zone, the 2nd and 3rd Halvings and the
-
BITCOIN Too many long term bullish indicators to ignore.
- December 22, 2019
- Posted by: Tradingshot Articles
- Category: Cryptocurrency
Just a quick reminder on the position Bitcoin is at on its long term cycle. As the title says there are just too many bullish indicators at this stage to ignore if you are a long term BTC investors. That doesn’t mean that the price “can’t” drop lower e.g. 5 – 5.5k but after the