

- December 22, 2019
- Posted by: Tradingshot Articles
- Category: Cryptocurrency
Just a quick reminder on the position Bitcoin is at on its long term cycle. As the title says there are just too many bullish indicators at this stage to ignore if you are a long term BTC investors. That doesn’t mean that the price “can’t” drop lower e.g. 5 – 5.5k but after the June decline and given Bitcoin’s long term trend, we won’t have too many opportunities from now on to buy at a lower price.
*RSI declines in Bull Markets*
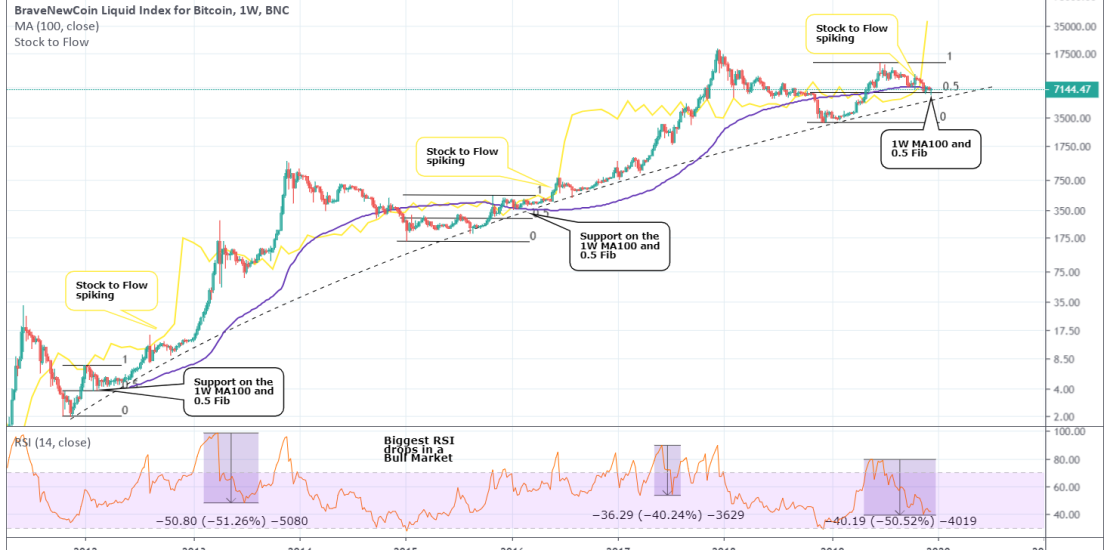
What stands out to me and is something I want traders to pay close attention to, is the RSI on the 1W chart. Since the begining, BTC had its strongest RSI decline (when trading within a Bull Cycle) at around -51%. We are about to match this drop on the ‘current’ June bearish sequence.
*0.5 Fibonacci providing support*
After each Bear Cycle’s bottom and following the first High of the new Bull Cycle, a 0.5 Fibonacci retracement always provided Support. We are again on that level.
*1W MA100*
Similarly, the MA100 on the 1W chart always provided support after the bottom was made. In fact once broken, we never crossed below it until the next Bear Cycle.
*Stock to Flow indicator*
This indicator evaluates the current stock of Bitcoin against the flow of new production. A higher ratio indicates that Bitcoin is increasingly scarce and therefore more valuable as a Store of Value. Normally when this is spiking, Bitcoin is preparing for the parabolic phase of the Bull Cycle. Right now this indicator is spiking.
Again I need to be clear that the above indicators are for investors who wish to know when good opportunities exist to add (buy coins) to their portfolio and not for short term traders.
Do you think this is an optimal long term level to buy? Let me know in the comments section!
Please like, subscribe and share your ideas and charts with the community!
Tradingview link: