- February 22, 2020
- Posted by: Tradingshot Articles
- Category: Cryptocurrency

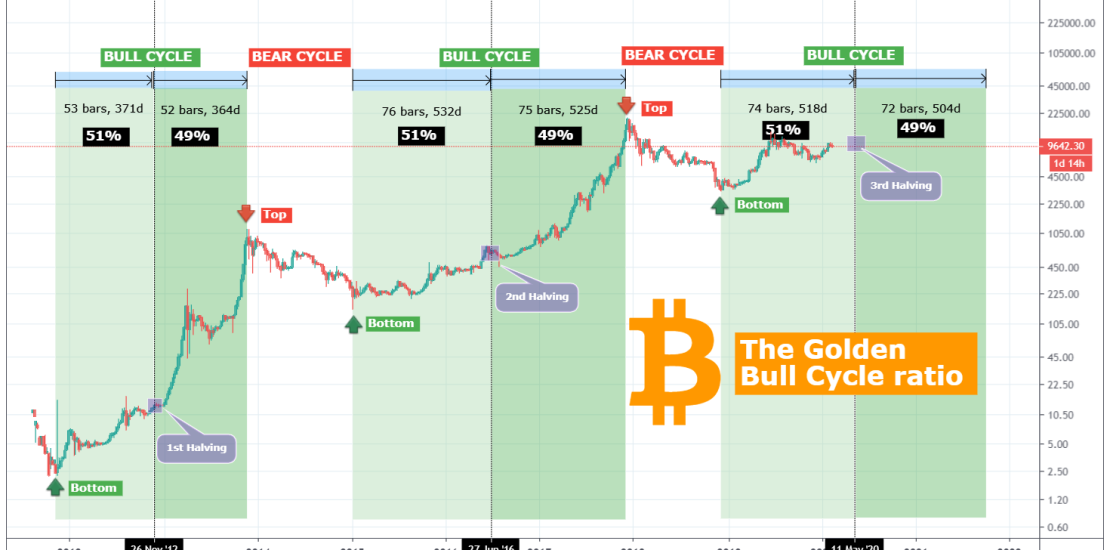
This is a really simple Bitcoin study on which I calculate the remaining days of the current Bull Cycle we are in based on the Top, Bottom and Halving of each Cycle. These parameters are effectively used to distinguish the Bull from the Bear Cycles. Tops are obviously where the Bull phase ends and Bear starts, while the Bottoms are where the Bear phase ends and the Bull starts.
** The 51%-49% Ratio and the important of the Halvings **
The focus of this study is the Bull Cycle. As you see on the chart there is a striking similarity on each Cycle. The phase from the Bottom to the Halving is 51% of the whole Bull Cycle while the rest (Halving to Top) consists the 49%. Practically we can claim that the Halving seems to be the middle of each Bull Cycle.
** So where are we now? **
Based on the above ratio and with the 3rd Halving scheduled on May 12th, 2020, we can calculate that the first phase (51%) of the current Bull Cycle will last around 520 days (Bottom made on December 15th 2018). The 49% which based on the previous two cycles has been the second phase should therefore last around 505 days, placing the Top of the current Bull Cycle in early October 2021! This means that there are around 600 days of Bull Cycle left!!
Of course there are and will be several other parameters that can influence the cycle (we saw that on the April-June 2019 parabolic explosion) but this is a good (and so far very accurate) pattern that long term Bitcoin investors can follow. It certainly answers the question “is it too late to buy?” though!
Do you agree with this estimate of have another pattern in mind? Let me know in the comments section!
Please like, subscribe and share your ideas and charts with the community!
BONUS MATERIAL a shorter term perspective:


