- December 24, 2019
- Posted by: Tradingshot Articles
- Category: Cryptocurrency

Before starting my analysis I want to wish everyone Merry Christmas!
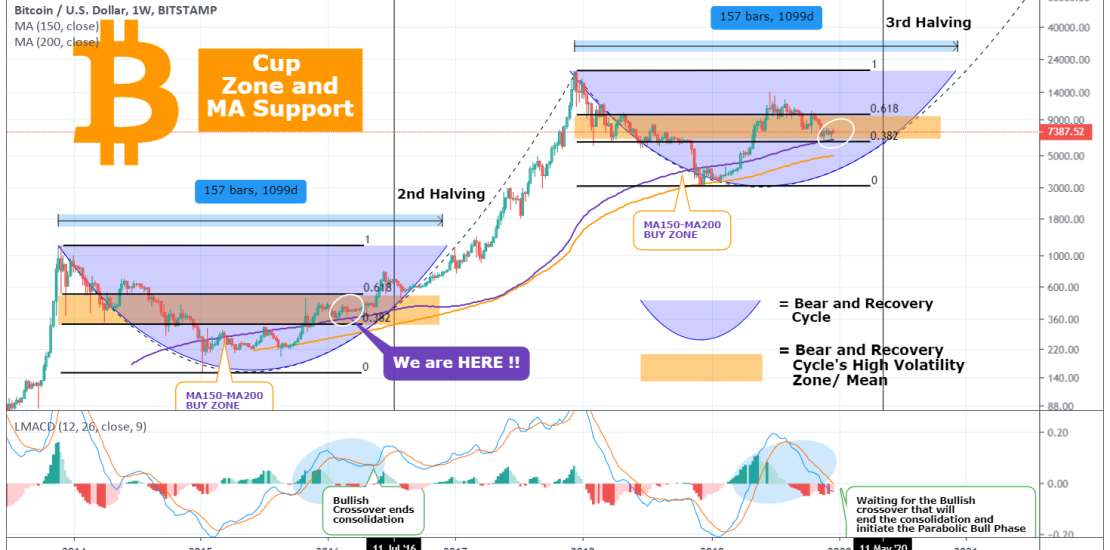
Now, I have made this chart in an attempt to put all correlating factors of Bitcoin’s previous and current cycle into perspective. The parameters that I am focusing on are the MA150/200, the Cycles’ High Volatility Zone, the 2nd and 3rd Halvings and the LMACD.
*MA150/200 Buy Zone*
I don’t want to go into much detail on this one, it is a concept I have analyzed extensively in the past. On the 1W chart the zone between the MA150 and MA200 has been the bottom (thus best buy entry) on every Cycle.
*The High Volatility Zone*
While the MA150/200 zone provided the bottom there is a certain zone that during the Bear Cycle and first year of Recovery attracts the Highest Volatility and is acting as the Cycle’s mean. I have named that “High Volatility Zone” and on our chart is the orange area between the 0.382 and 0.618 Fibonacci retracement levels. I have also analyzes this concept in the past, you can find pieces of my work at the end of this analysis.
At the moment BTC is trading right above the 1W MA150 (blue trend line) after finding Support (so far a Double Bottom) following the recent fall. The MA150 happens to be now on the 0.382 Fibonacci level. The price traded on the exact same level (white circle on our chart) during February/ March 2016. Basically we can claim that Bitcoin is again consolidating within the High Volatility Zone after finding support on the MA150. The only difference with the previous Cycle is that this year the price made a break-out (on bullish news) above the Zone in June, but was eventually corrected back into it.
*The LMACD*
That brings us to why the LMACD is important in timing the start of the next aggressive Bull run. Due to that break out above the High Volatility Zone in June, the LMACD indicator never showed the consolidation it did on the previous Cycle and just as it rose aggressively, it is on an equally strong decline at the moment. What I am waiting for (and I am guessing the majority of BTCUSD traders out there) is the Bullish Crossover on the LMACD, which will essentially be the signal that the consolidation within the High Volatility Zone has ended and we are about to enter the Parabolic Bull Phase to new All Time Highs (ATH).
*The Halvings*
Now of course the Halvings play a key part into this. In 2016 the consolidation ended right before the July 2016 Halving (2nd). After a supply shock and subsequent decline, we entered well into the Parabolic Bull phase that lasted all the way to the $19900 ATH. Right now the (3rd) May 2020 Halving is not that far away and we may witness a similar price action.
CONCLUSION
So why wait until the events pass by you? This is in my opinion the best time to start accumulating BTC if you are a long term investor. The price is at the bottom of the Cycle’s High Volatility Zone, supported by the 1W MA150, a few months before the Halving event that always starts the new Bull and with the LMACD close to pricing a Bullish Crossover.
But what do you think? Is this the best spot/ time to start buying again? Let me know in the comments section!
Please like, subscribe and share your ideas and charts with the community!
Related material:
Bonus (December 2018 vs 2019 bottom fractals similarities):


