
-
EGLDUSD Critical Lower High test
- May 10, 2022
- Posted by: Tradingshot Articles
- Category: Cryptocurrency
No Comments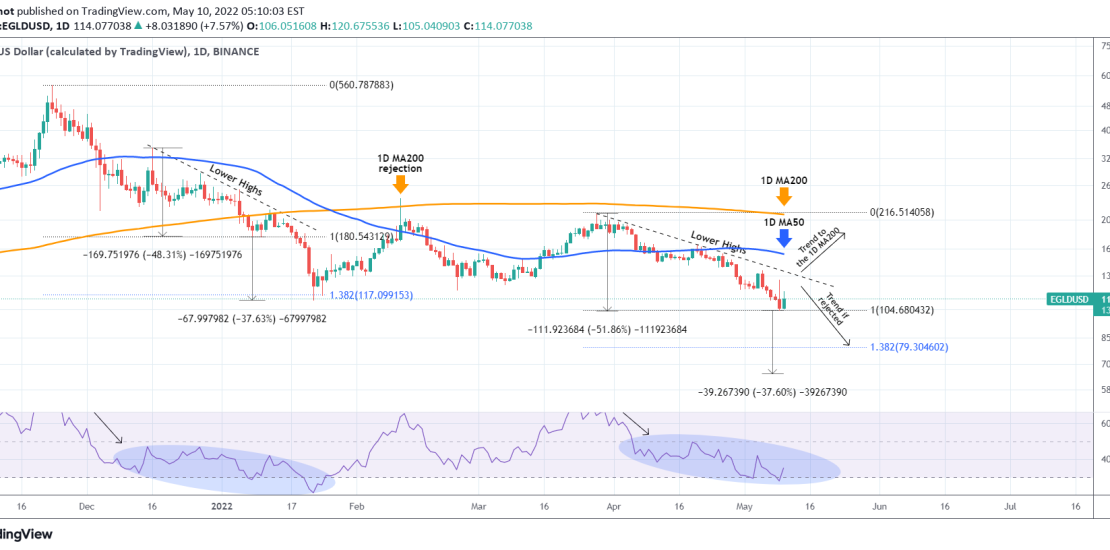
Elrond (EGLDUSD) is having a strong 1D green candle currently but it remains under the selling pressure of a Lower Highs trend-line since the March 28 High. That price action in fact resembles the selling pattern of December 2021 – early January 2022. The price continuously failed to break above the Lower Highs and
-
ALGOUSD on a strong bullish streak but not a Buy Opportunity yet
- May 3, 2022
- Posted by: Tradingshot Articles
- Category: Cryptocurrency
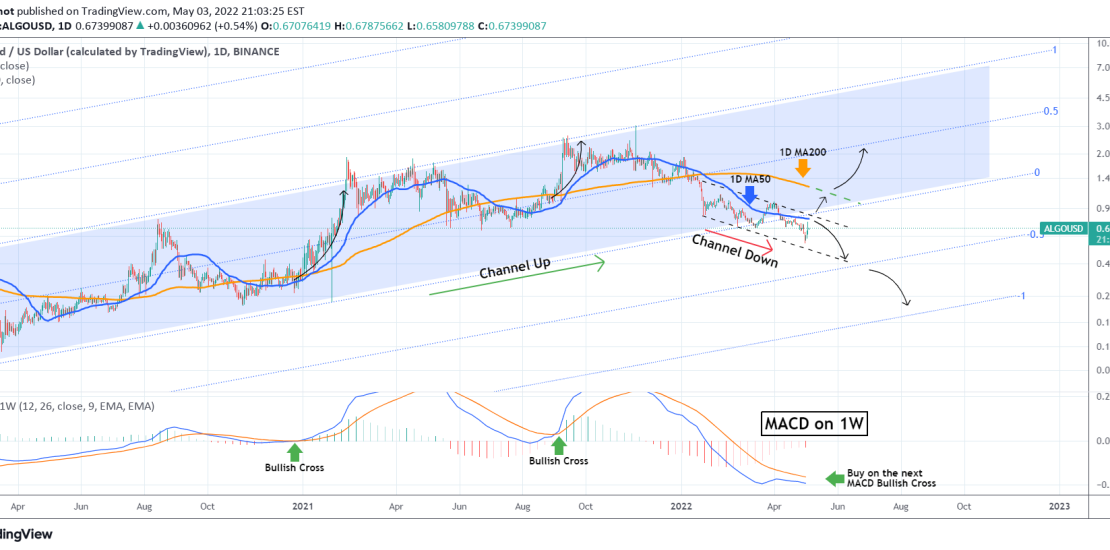
Algorand (ALGOUSD) has completed a strong 3 day bullish streak coming close to the 1D MA50 (blue trend-line) again for the first time since the first week of April. Despite this green short-ter display, it is not a buy opportunity yet, as on the medium-term it remains within a Channel Down (dashed lines) and
-
XRPUSD Critical crossroads! Which scenario will prevail?
- April 14, 2022
- Posted by: Tradingshot Articles
- Category: Cryptocurrency
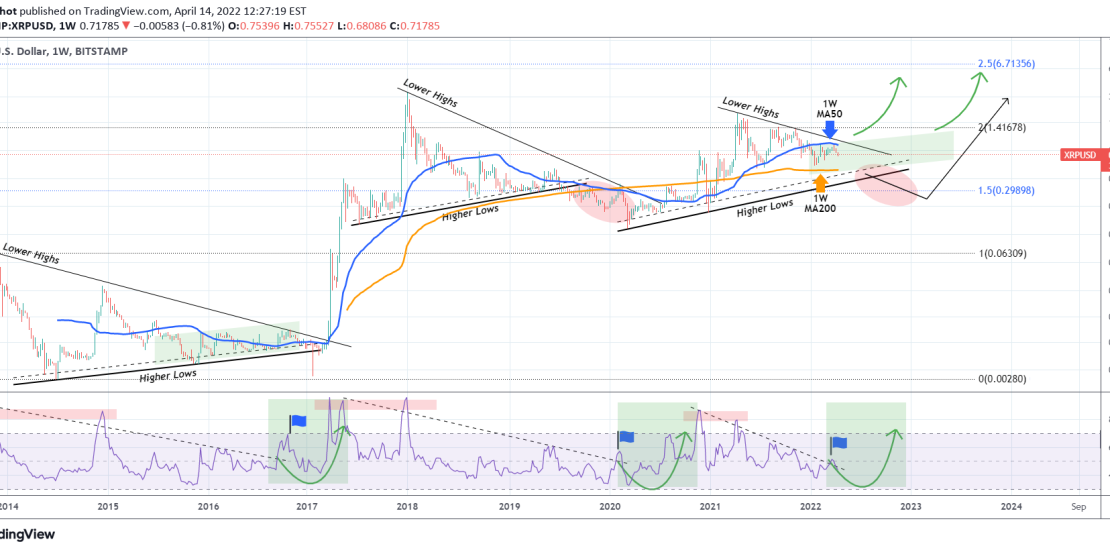
XRPUSD got rejected on the 1W MA50 (blue trend-line) for the second time in two months. Basically, it has been trading below the 1W MA50 for the whole year. At the same time it has been trading under the bearish pressure of the Lower Highs trend-line since the April 2021 High. This is not
-
CARDANO can’t get out of this death spiral
- March 15, 2022
- Posted by: Tradingshot Articles
- Category: Cryptocurrency
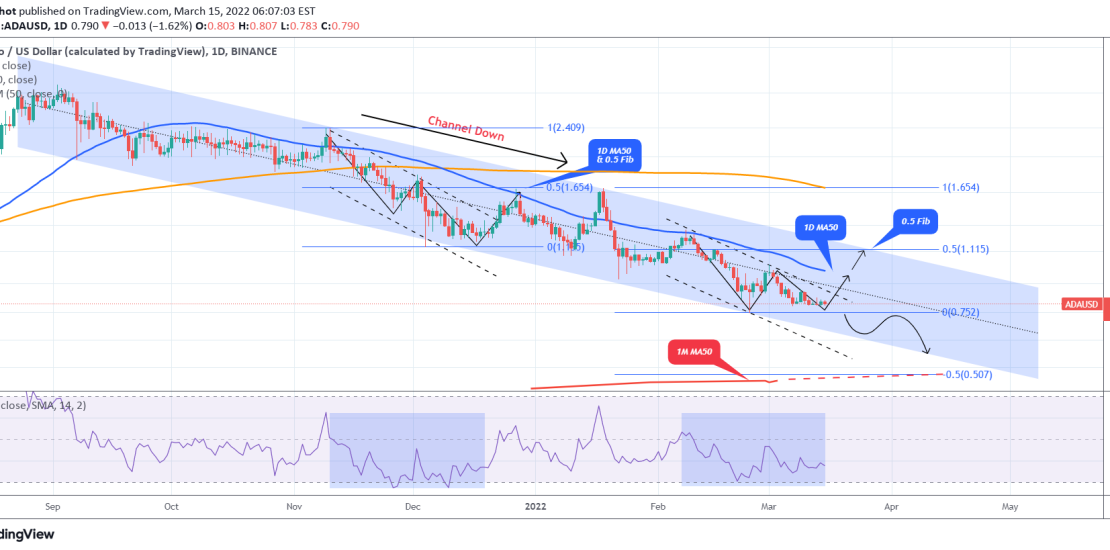
ADAUSD (Cardano) has been trading inside a Channel Down ever since its September 02 2021 All Time High (ATH). That is a significant amount of time it has been on a bearish trend and the pure structure of this Channel Down, doesn’t seem to allow much room for hope, at least not yet. Right
-
MANAUSDT Bear Flag on 1D. Attention needed.
- November 29, 2021
- Posted by: Tradingshot Articles
- Category: Cryptocurrency
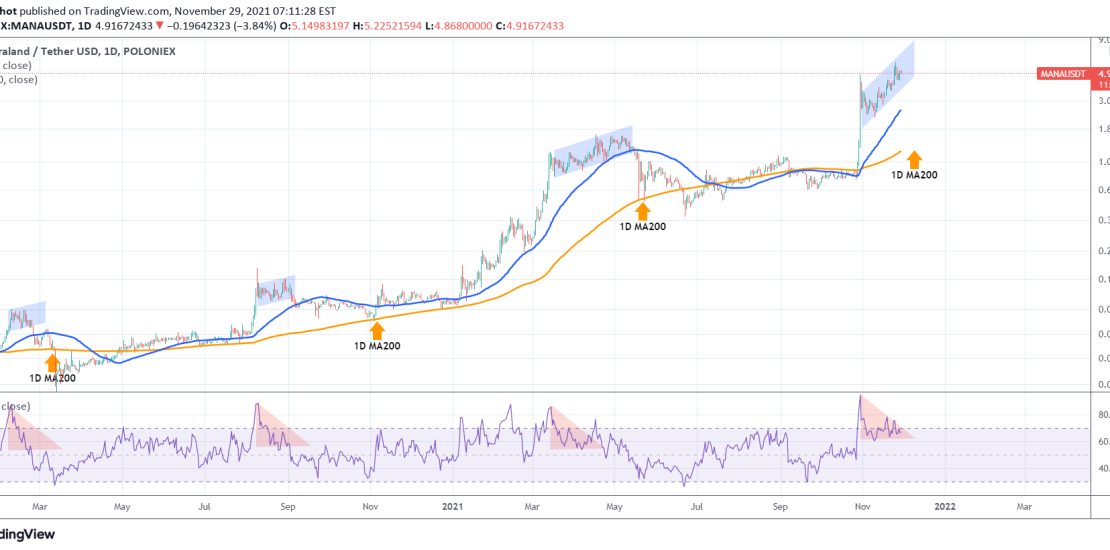
MANA has seen extreme gains on a 1 month horizon. However buyers should be careful at this stage as on the 1D time-frame, the price is printing a Bear Flag, the likes of which has been a strong red signal in the past. As you see on the chart, every time this pattern along
-
BITCOIN Moment of truth after China ban. Which Channel prevails?
- September 24, 2021
- Posted by: Tradingshot Articles
- Category: Cryptocurrency
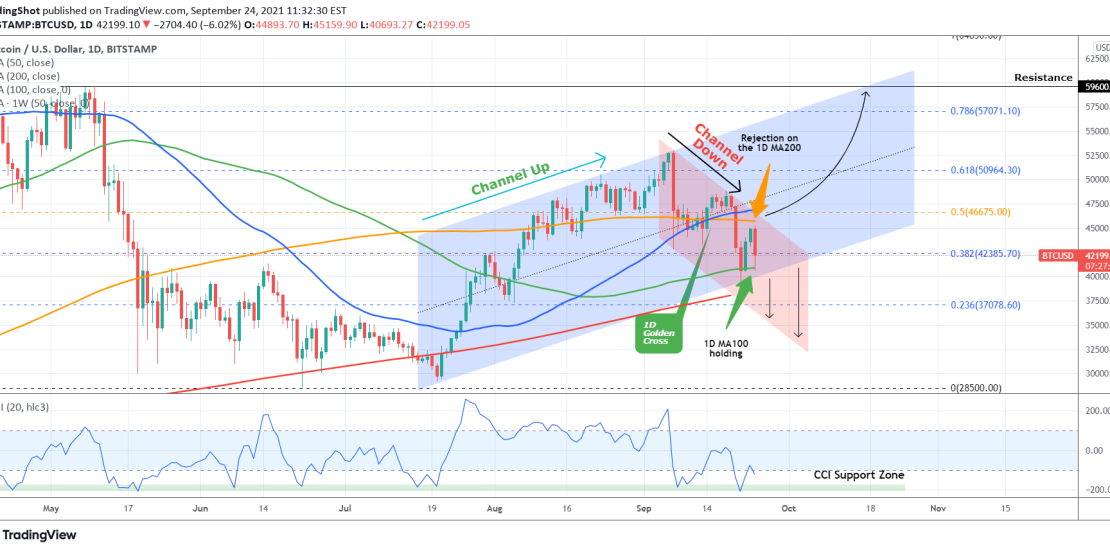
Bitcoin is on the back foot again, suffering significant losses following the new round of China bans on crypto trading. Although the market has faced (successfully) this threat before (even recently) and is not something unfamiliar, traders need to consider mostly the psychological effect this may have to weak hands. Technically though there are
-
BITCOIN Is it realistic to expect a repeat of this fractal?
- September 10, 2021
- Posted by: Tradingshot Articles
- Category: Cryptocurrency
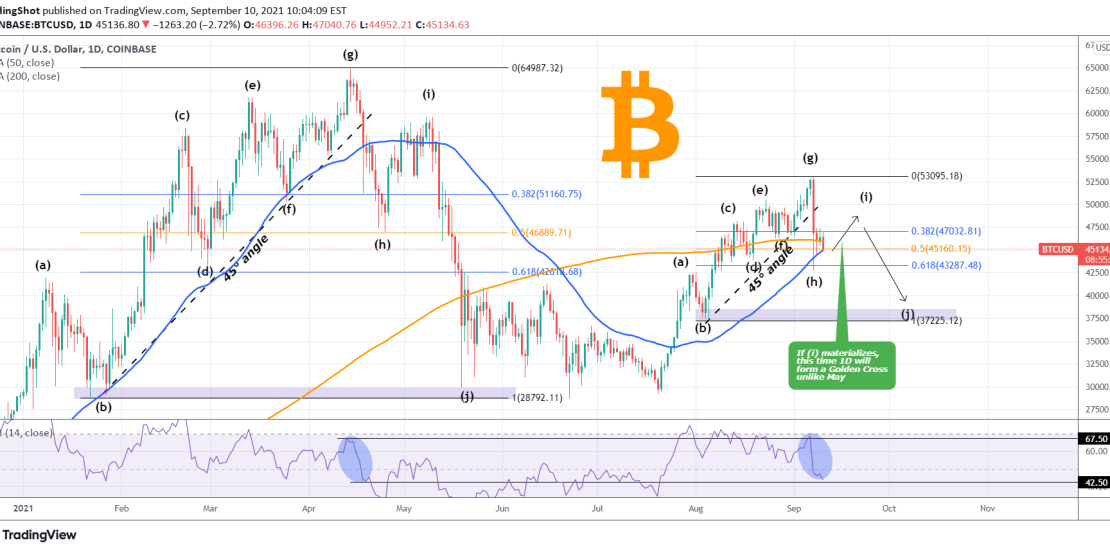
If you followed me for long here on TradingView and on reddit in the past, then you know I am a big supporter of fractal analysis. As a result I had to bring you today’s fractal comparison and will explain how it can be invalidated even though so far it has been astonishingly identical.
-
BITCOIN -20% correction in a day! Is the bleeding over?
- September 7, 2021
- Posted by: Tradingshot Articles
- Category: Cryptocurrency
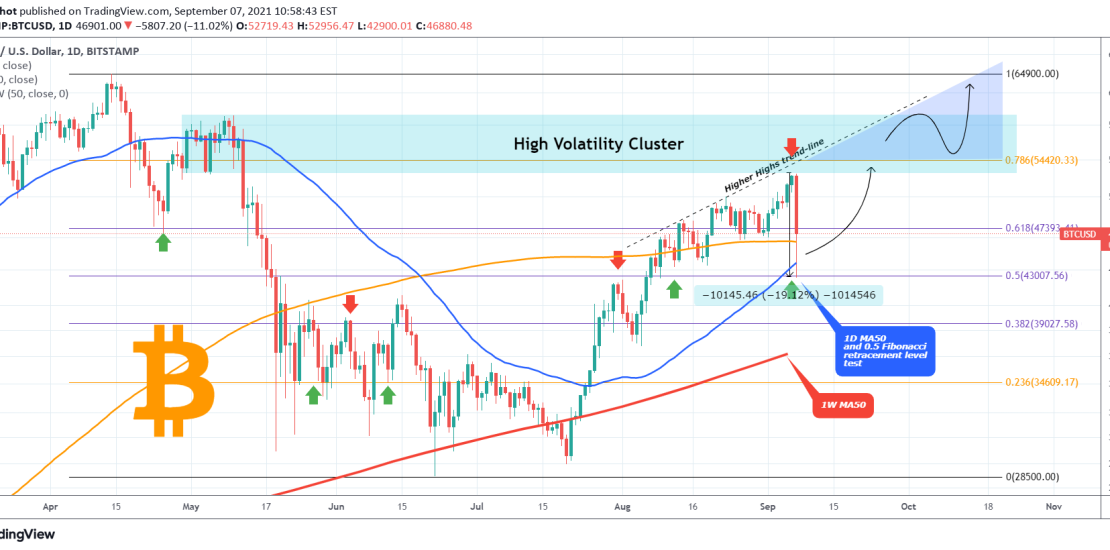
On my last Bitcoin analysis I underlined the importance that Fibonacci retracement levels along with the 1D MA50 (blue trend-line) will play on this recovery attempt. Today is a correction day for BTC with the price losing almost -20% intra day so far. The drop has been contained exactly on the 0.5 Fibonacci retracement
-
BITCOIN fun fractal.. or something more?
- August 28, 2021
- Posted by: Tradingshot Articles
- Category: Cryptocurrency
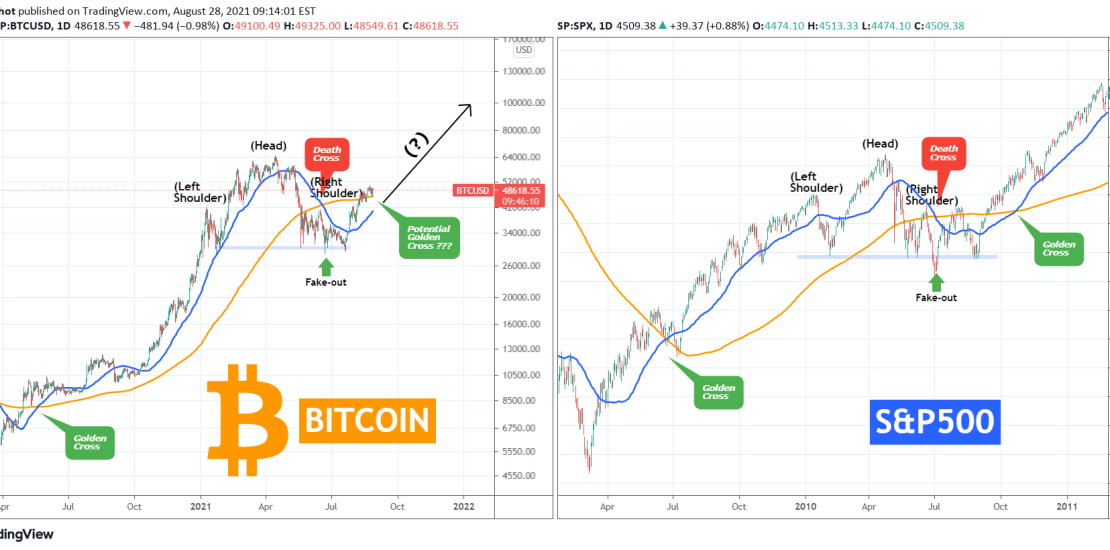
Those who follow me since my start here on TradingView or even way back on Reddit know that I am a big fun fractal comparison. I have been using this approach extensively especially on long-term technical analysis and more often than not, proves to be quite efficient. The fractal comparison I am bringing to you
-
BITCOIN is testing the 1D MA200, key to continue the Bull Cycle.
- August 7, 2021
- Posted by: Tradingshot Articles
- Category: Cryptocurrency
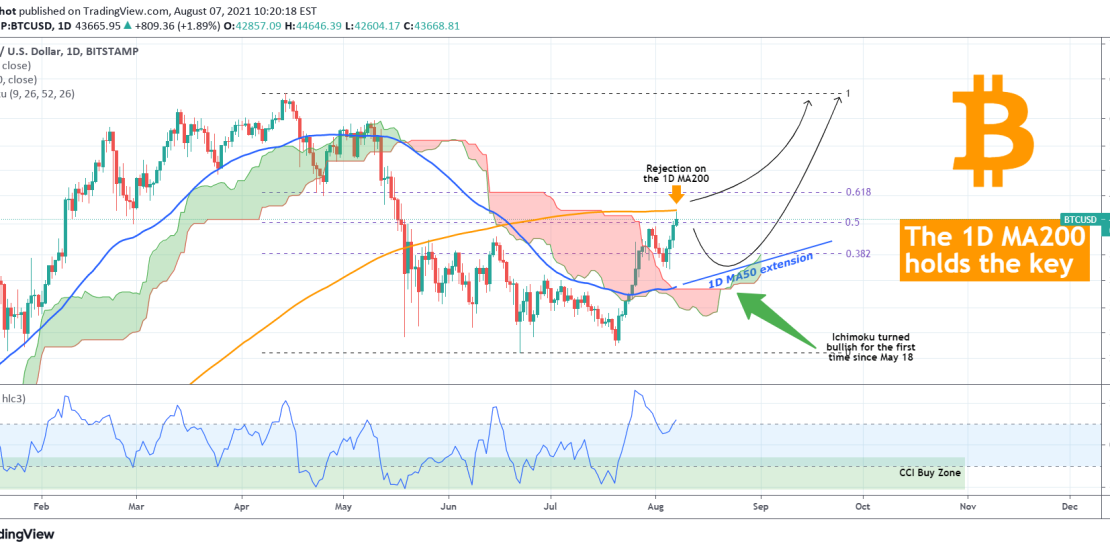
Not that long ago, on July 21, when Bitcoin hit its two month Support Zone of 29000 – 30100 and Triple Bottomed, I posted the following analysis indicating that the Target was the 1D MA200 (orange trend-line): Well today the price finally reached that level after 72 days (first time since May 26), and
