

- May 10, 2022
- Posted by: Tradingshot Articles
- Category: Cryptocurrency
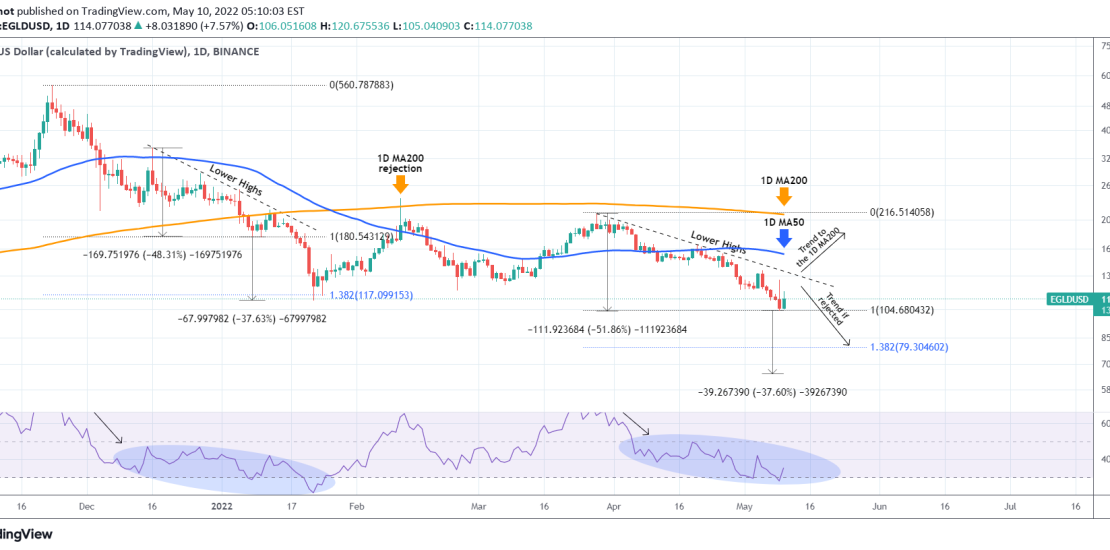
Elrond (EGLDUSD) is having a strong 1D green candle currently but it remains under the selling pressure of a Lower Highs trend-line since the March 28 High. That price action in fact resembles the selling pattern of December 2021 – early January 2022. The price continuously failed to break above the Lower Highs and as a result dipped another -37% to price the January 22 Low.
A -37% from yesterday’s lowis around the $65.45 mark. If the 2021 fractal is however counted from the November 23 High (with the 1D RSI agreeing to this), then a 1.382 Fibonacci extension would be more accurate for the next Low in case of a rejection, which is currently around $79.30.
If however the Lower Highs trend-line breaks, we expect aggregated buying towards the 1D MA200 (orange trend-line) as in the case of the February 11 High.
Tradingview link:
https://www.tradingview.com/chart/EGLDUSD/Zs2kKmQf-EGLDUSD-Critical-Lower-High-test