

- August 7, 2021
- Posted by: Tradingshot Articles
- Category: Cryptocurrency
Not that long ago, on July 21, when Bitcoin hit its two month Support Zone of 29000 – 30100 and Triple Bottomed, I posted the following analysis indicating that the Target was the 1D MA200 (orange trend-line):

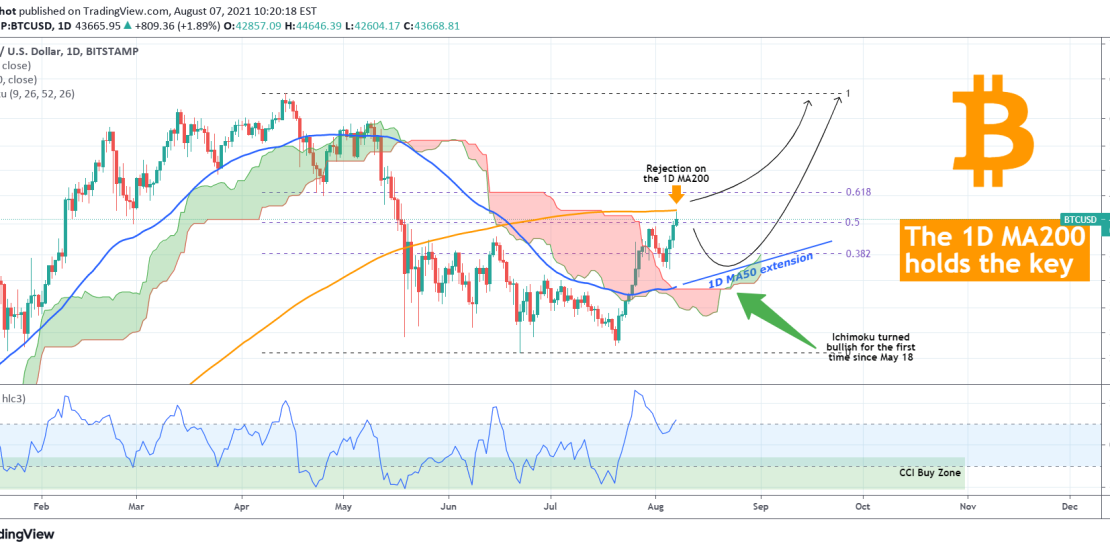
Well today the price finally reached that level after 72 days (first time since May 26), and what we have so far is a rejection. As long as it doesn’t break (and close a week above it), it is not ideal for the bullish case. BTC’s historic price volatility indicates that the 1D MA200 is what differentiates the Bull Market from the Bear Market. It is that one last barrier, which if unbroken, Bitcoin confirms entering a Bear Cycle.
The following charts clearly illustrate this case for the previous Bear Cycles:
As you see during the 2018 Bear Cycle the price was rejected four times on the 1D MA200, failing to break above the 0.5 Fib retracement level. That put the market into a multi-month limbo.
In 2014, the price broke both above the 0.5 Fib and the 1D MA200 but only marginally.
In the 2011 Bear Cycle, again it broke the 1D MA200 only marginally in early 2012 (but again failed to break the 0.5 Fib). When it closed and traded for the first few weeks above it, the new Bull Cycle started.
Perhaps a similar situation to the current sequence is the January 2020 1D MA200 test. As the chart below shows, the price was initially rejected on the 1D MA200 and just below the 0.5 Fib but only for a few days, after it eventually broke above both, even the 0.618 Fibonacci which has never been the case in the previous three Bear Cycles mentioned above. The fact that a market melt-down was followed in March, isn’t at all related to the technicalities of the MA200 breaking, as a market collapse due to a once in 100 years pandemic, is not a technical event:
Furthermore, the CCI action today is very similar to then, also to October 2020 and December 2020. Perhaps the golden sequence that indicates Bull Cycle continuation is the combination of breaking above the 1D MA200 (weekly closing above) and the 0.618 Fib. Right now BTCUSD is testing the 1D MA200, above the 0.5 Fib with the 0.618 located at 47500 (all Fibs on log levels).
Do you think the golden combination of breaking the 1D MA200 and the 0.618 Fib will take place eventually, and if it does will that signal the continuation of the Bull Cycle to new All Time Highs (ATH)? Feel free to share your work and let me know in the comments section!
Tradingview link: