
-
ETHBTC Bearish Cross on MACD
- September 13, 2022
- Posted by: Tradingshot Articles
- Category: Cryptocurrency
No Comments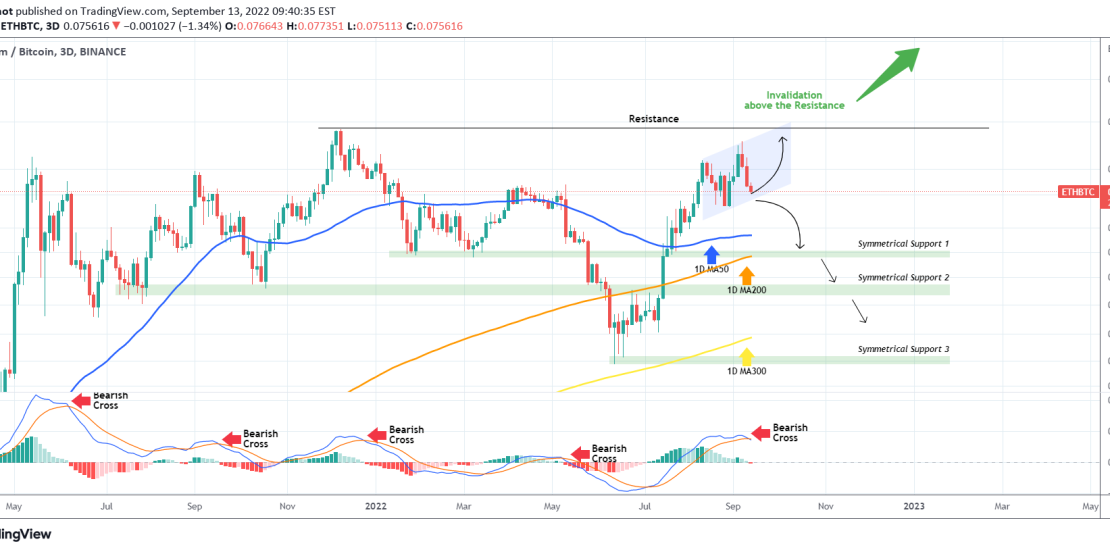
This is yet another chart on the 3D time-frame, which time after time has proved to be reliable in catching medium-term price trends. This time on the ETHBTC pair, the 3D MACD just formed a Bearish Cross. As you see, since the June 06 2021 candle (so more than a year), every such formation
-
ETCUSD Channel Down or Bull Flag? See how to trade it!
- September 8, 2022
- Posted by: Tradingshot Articles
- Category: Cryptocurrency
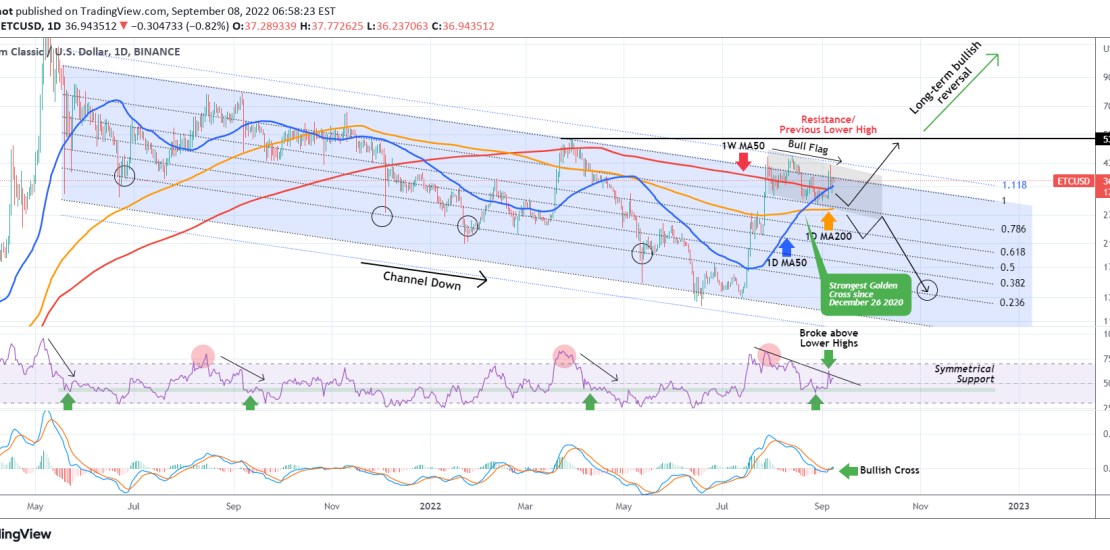
Ethereum Classic (ETCUSD) has been trading within a Channel Down on the medium-term, since the July 29 High. This has come after an enormous and very quick +250% rise on fundamentals, since the July 13 Low. The overall trend since the May 2021 market high has been bearish inside a Channel Down pattern. You
-
LUNCUSDT What to watch out on the short-term
- September 8, 2022
- Posted by: Tradingshot Articles
- Category: Cryptocurrency
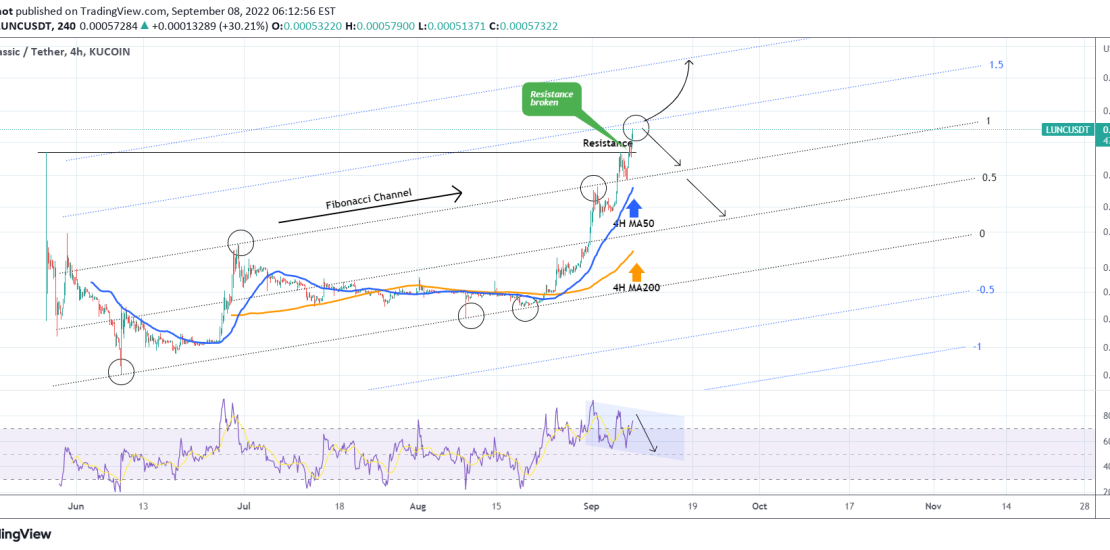
*** *** For this particular analysis on Terra Classic we are using the LUNCUSDT symbol on the KuCoin exchange. *** *** The idea is on the 4H time-frame where LUNC is extending the parabolic rise it has been on since the August 19 Low. As we mentioned in our previous analysis the break-out above
-
LDOUSDT Repeating April’s bearish fractal unless this breaks.
- August 31, 2022
- Posted by: Tradingshot Articles
- Category: Cryptocurrency
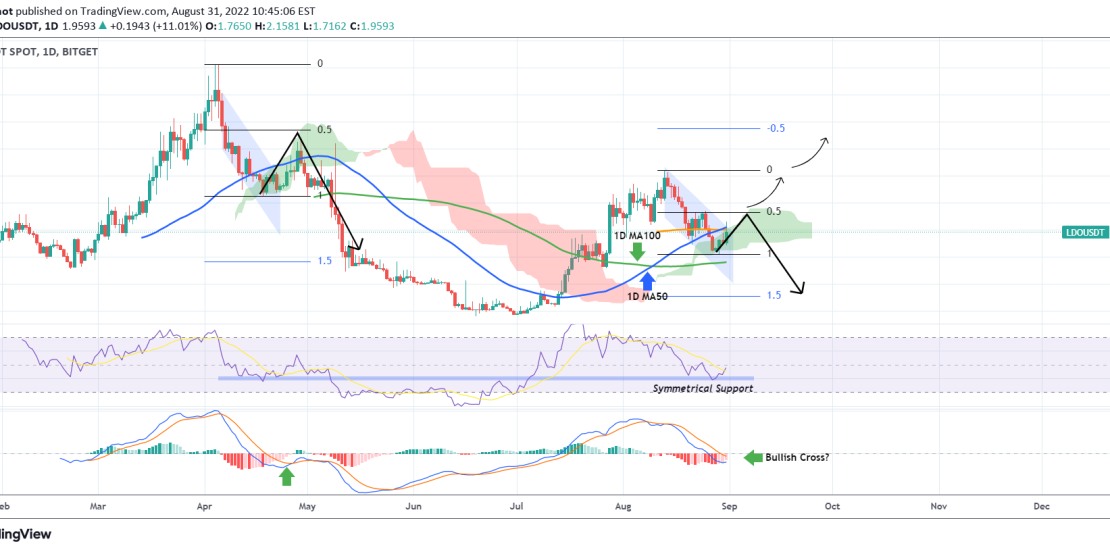
LIDO DAO (LDOUSDT) broke above its 1D MA50 (blue trend-line) today as so far the correction since the August 13 High was contained inside the green Ichimoku Cloud. This isn’t yet the time to be bullish, as the same Cloud provided support from April 18 to April 28 and despite breaking again above the
-
CELUSD broke the 1D MA200, first time since last September!
- August 9, 2022
- Posted by: Tradingshot Articles
- Category: Cryptocurrency
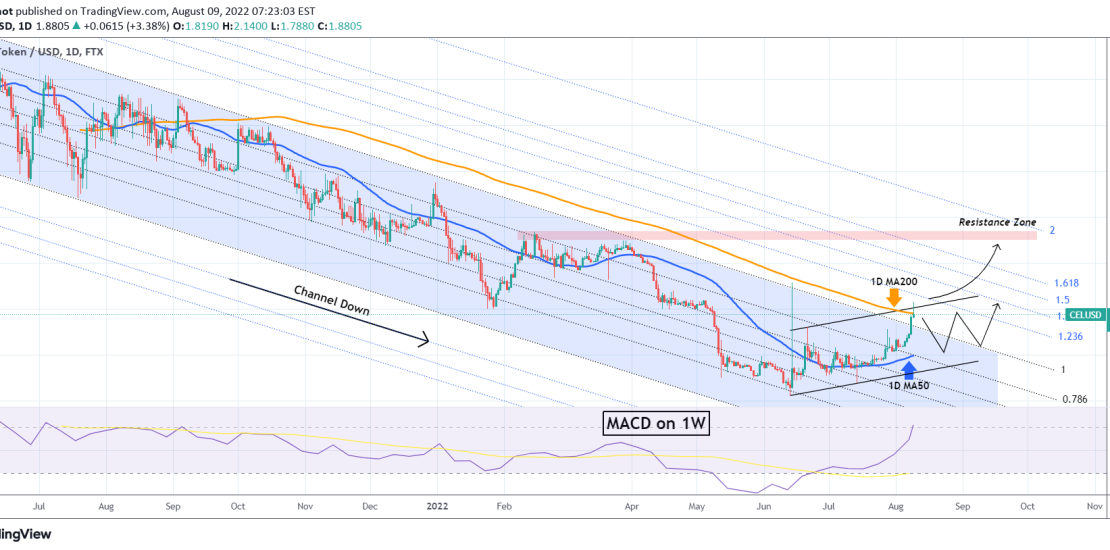
The Celsius Token (CELUSD) broke today above its 1D MA200 (orange trend-line) for the first time since September 07 2021. It is important to see the price close above that level too, as technically a lot of investors could take profits aggressively here. In that case, expect a pull-back to the 1D MA50 (blue
-
RVNUSD 0.0600 Ultimate Target
- July 29, 2022
- Posted by: Tradingshot Articles
- Category: Cryptocurrency
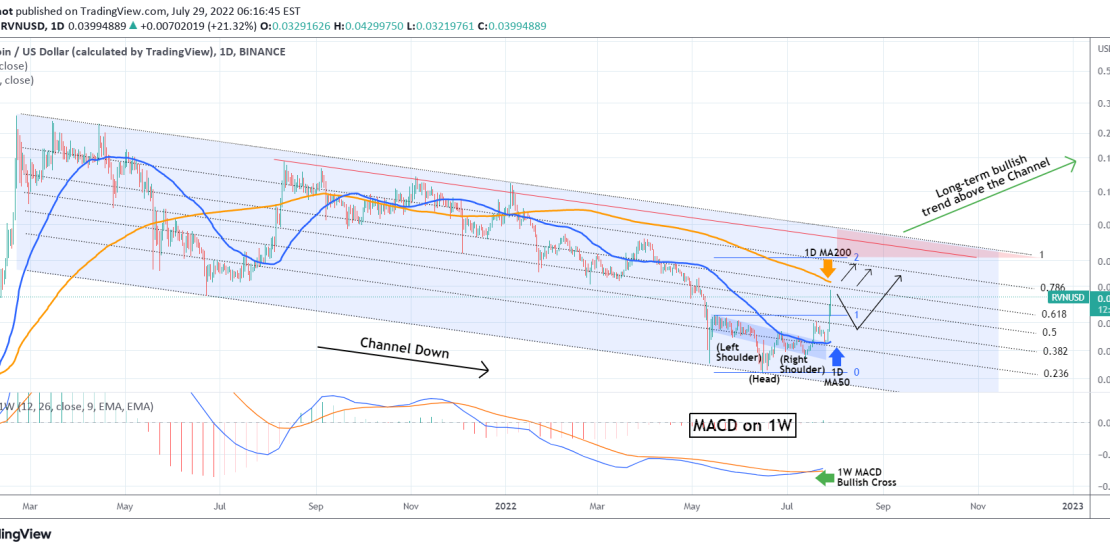
Ravencoin (RVNUSD) has seen a very strong and rapid growth in the past 3 days after rebounding on the 1D MA50 (blue trend-line) and is now very close to the 1D MA200 (orange trend-line). The last rise of such magnitude has been from July 30 to August 11 2021. RVN is doing so after
-
BITCOIN A mind-blowing approach to Cyclical Theory based on DXY
- July 28, 2022
- Posted by: Tradingshot Articles
- Category: Cryptocurrency
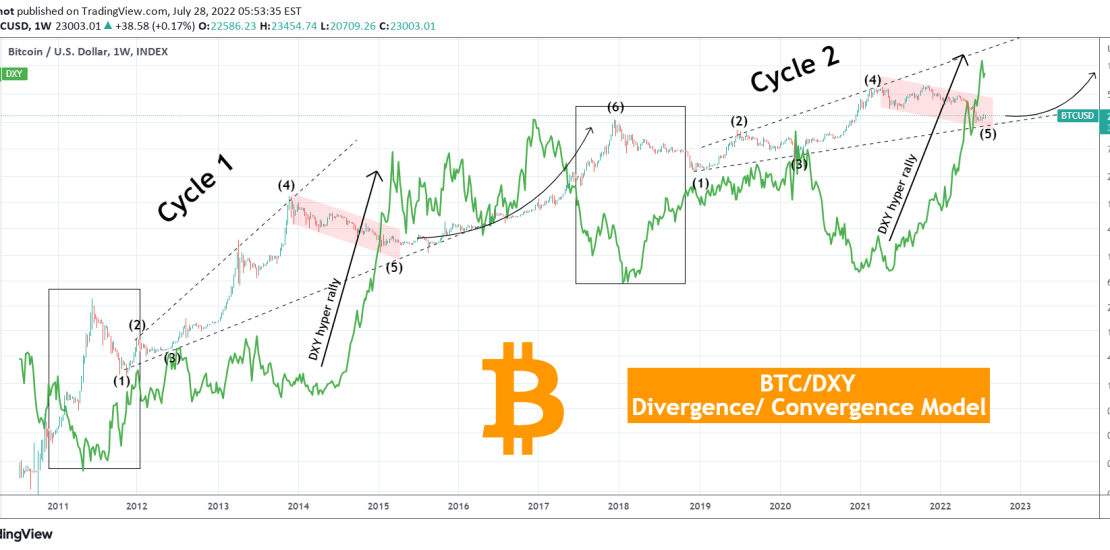
This is an alternative representation of Bitcoin (BTCUSD) and its Cyclical behavior based on the long-term price action of the U.S. Dollar Index (DXY). A simple yet eye-opening approach that links BTC to the USD more than any other asset. ** Traditional Cycle Theory vs BTC/DXY Divergence/ Convergence Theory ** Traditional theory suggests that
-
BITCOIN vs WTI Time to buy BTC and sell Oil. 4.5 year pattern!
- July 20, 2022
- Posted by: Tradingshot Articles
- Category: Cryptocurrency
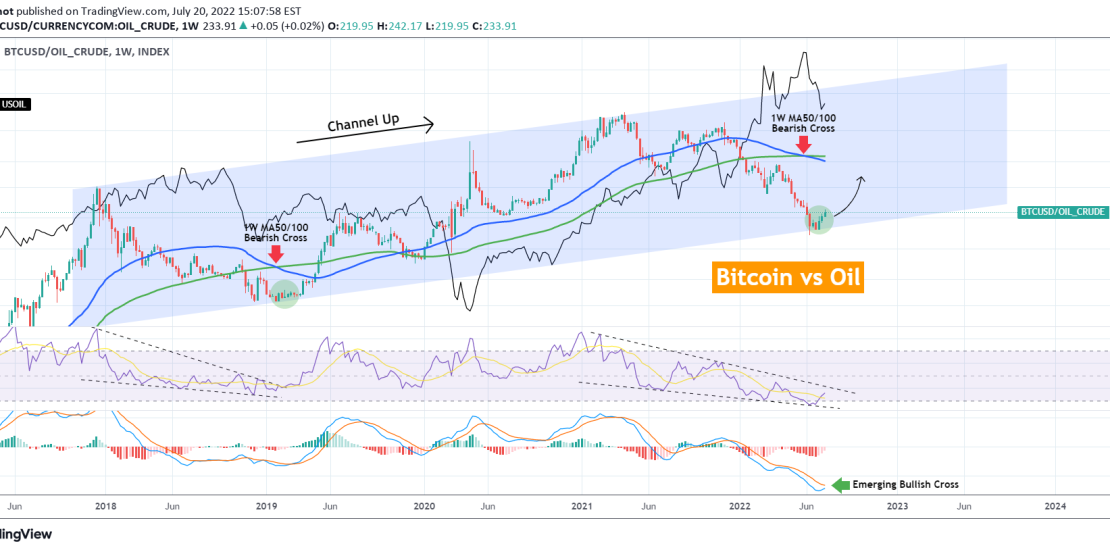
This chart represents the Bitcoin/WTI Oil ratio and reveals an interesting finding regarding where both markets could be headed. Since December 2017, the ratio has been trading within a Channel Up pattern. Following a 1W MA50/100 Bearish Cross (blue trend-line crossing below the green trend-line respectively) in January 2019, the symbol bottomed and started
-
KCSUSDT 1W MA100 test after 1 month.
- July 20, 2022
- Posted by: Tradingshot Articles
- Category: Cryptocurrency
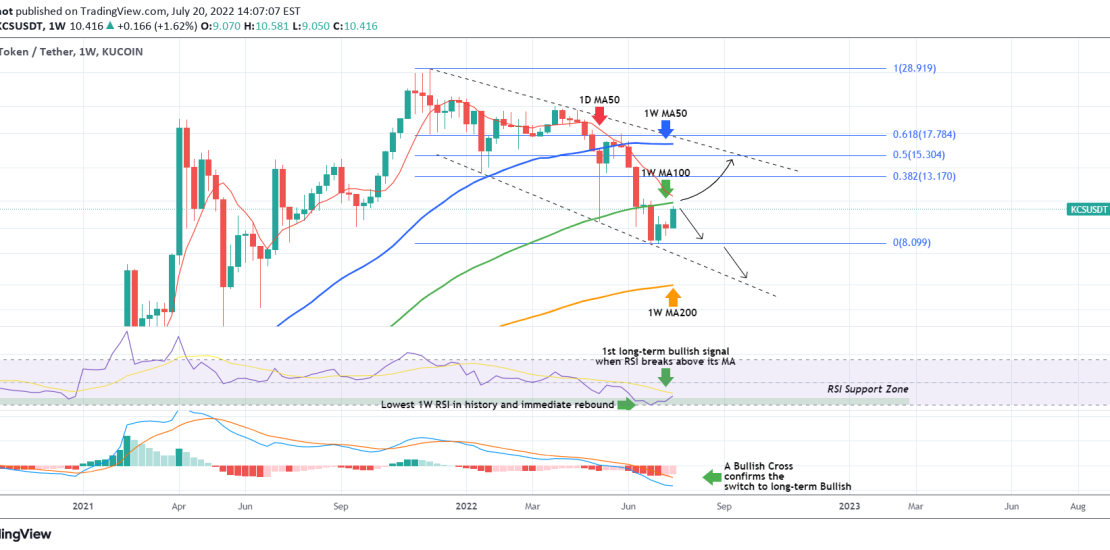
The KuCoin Token (KCSUSDT) is on a strong 1W green candle, the 2nd in a total of 3 weeks since the July 03 bottom. If it closes the week in green it will be the first time to have 2 green weeks among 3 since early April. The most important development though on
-
DOTUSD 8.80 short-term target
- July 16, 2022
- Posted by: Tradingshot Articles
- Category: Cryptocurrency
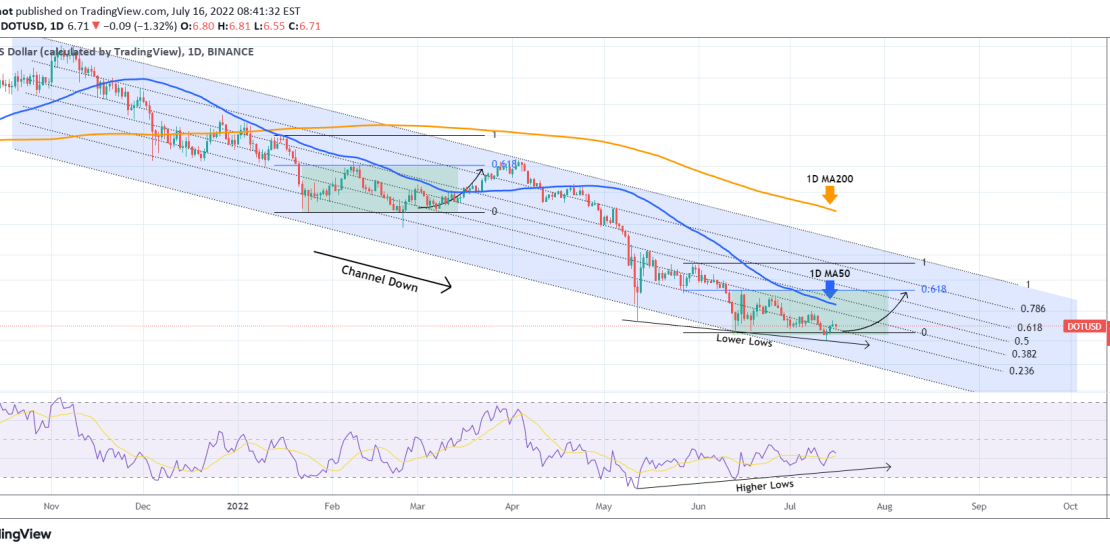
Polkadot (DOTUSD) has been trading within a clear Channel Down on the log scale ever since its last market top in November 2021. The price has been unable to break above the 1D MA50 (blue trend-line) since April 21. The recent Bullish Divergence on the 1D RSI though (being on Higher Lows against the
