

- July 20, 2022
- Posted by: Tradingshot Articles
- Category: Cryptocurrency
The KuCoin Token (KCSUSDT) is on a strong 1W green candle, the 2nd in a total of 3 weeks since the July 03 bottom. If it closes the week in green it will be the first time to have 2 green weeks among 3 since early April.
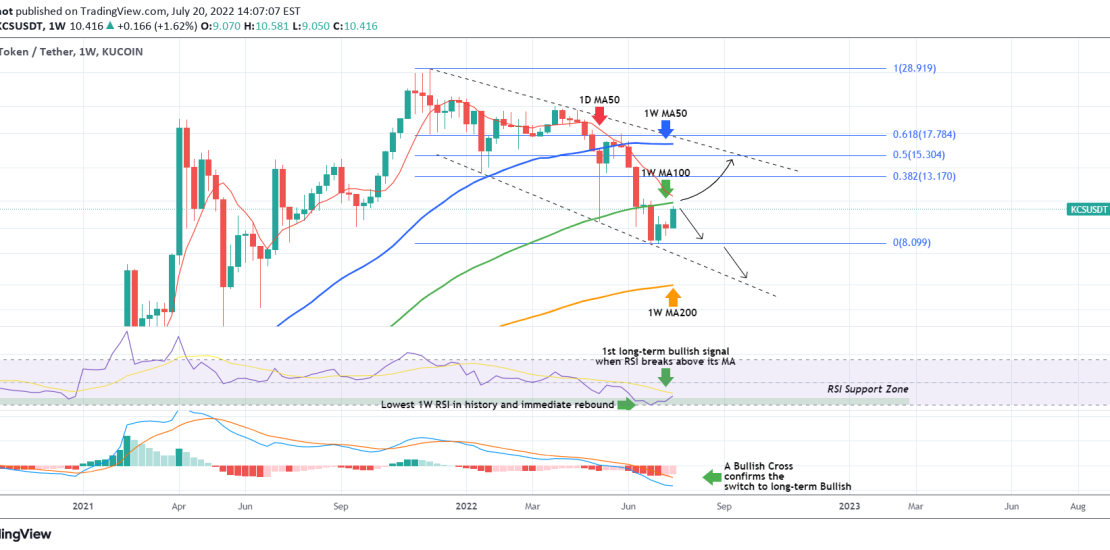
The most important development though on the 1W time-frame is that by doing so, the token is about to test the 1W MA100 (green trend-line) for the first time since the brutal break below on the June 27 weekly candle. That is a very quick recovery though, typically indicative in market bottom formations.
As you see, the 1W MA100 is the first Resistance test before the crucial 1D MA50 red trend-line), something we analyzed in our last post:

Failure to break above this Resistance cluster, risks an immediate rejection back to the 8.085 Low and if it breaks, selling extension to the Lower Lows trend-line of the long-term Bearish Megaphone pattern, which can make a 1W MA200 (orange trend-line) test for a new Market Bottom.
A break above the Resistance cluster of the 1W MA100 and 1D MA50, will target the top (Lower Highs trend-line) of the Megaphone, potentially on the 0.5 Fibonacci retracement level. Note that this is the more likely scenario to take place, especially if the 1W RSI breaks above its MA (yellow trend-line), as the RSI is rebounding after scoring the lowest reading in history. Watch also the 1W LMACD for a Bullish Cross, the first since October 18 2021, that will most likely confirm the shift to a new Bull Cycle. That will most likely coincide with a break above the 1W MA50 (blue trend-line).
Overall we are very bullish on KCSUSDT long-term.
Tradingview link:
https://www.tradingview.com/chart/KCSUSDT/nW6Sy0Bc-KCSUSDT-1W-MA100-test-after-1-month